Own Cash-Flowing Rental Properties in the Best U.S. Markets From Anywhere!

Search
Close this search box.

Welcome to Cleveland!

ABOUT Cleveland

Cleveland was ranked Top 3 Hottest Housing Markets for 2023 by Zillow! In 2024, it remains one of the most investor-advantaged real estate markets in the U.S.. Over the past 8 years, Cleveland has been on a stunning resurgence, being named “America’s Hottest City” by Forbes, “Top 15 U.S. Cities for College Grads” by SmartAssets and “Top 20 Places in the WORLD” to Visit by National Geographic! Long-time home of the Rock & Roll Hall of Fame, Cleveland also became a choice filming destination for blockbuster movies like “The Avengers” and “Captain America: Winter Soldier”. And, while the city is abuzz with revitalization projects and a burgeoning food and arts scene, the cost of living is 6% below the national average and the cost of housing remains a full 18% below the national average (source: RentCafe).

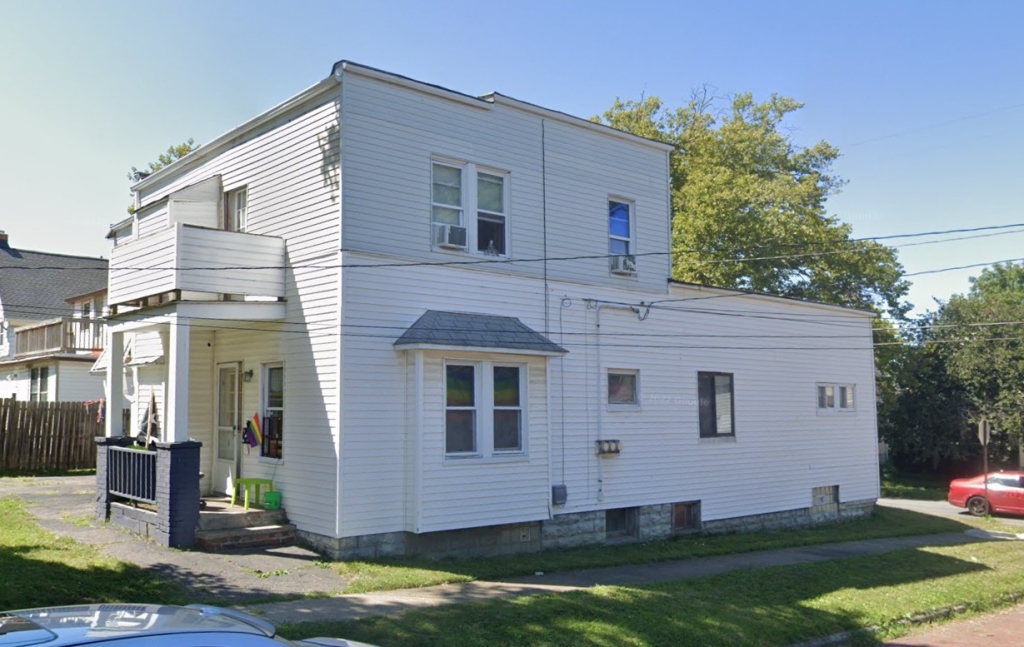
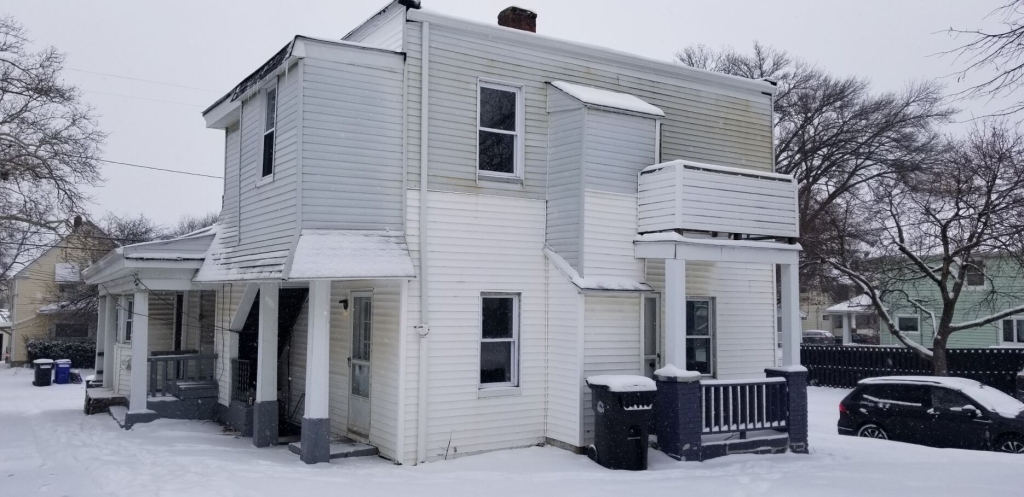
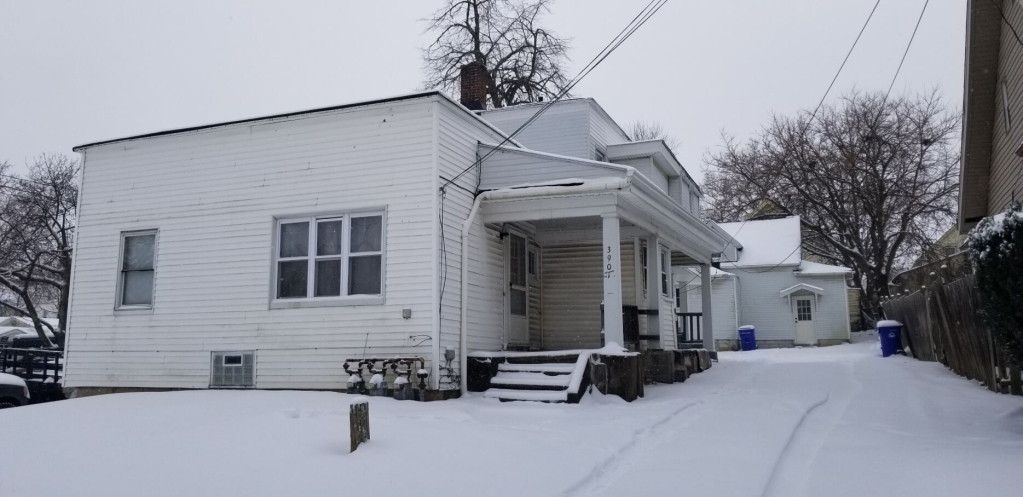
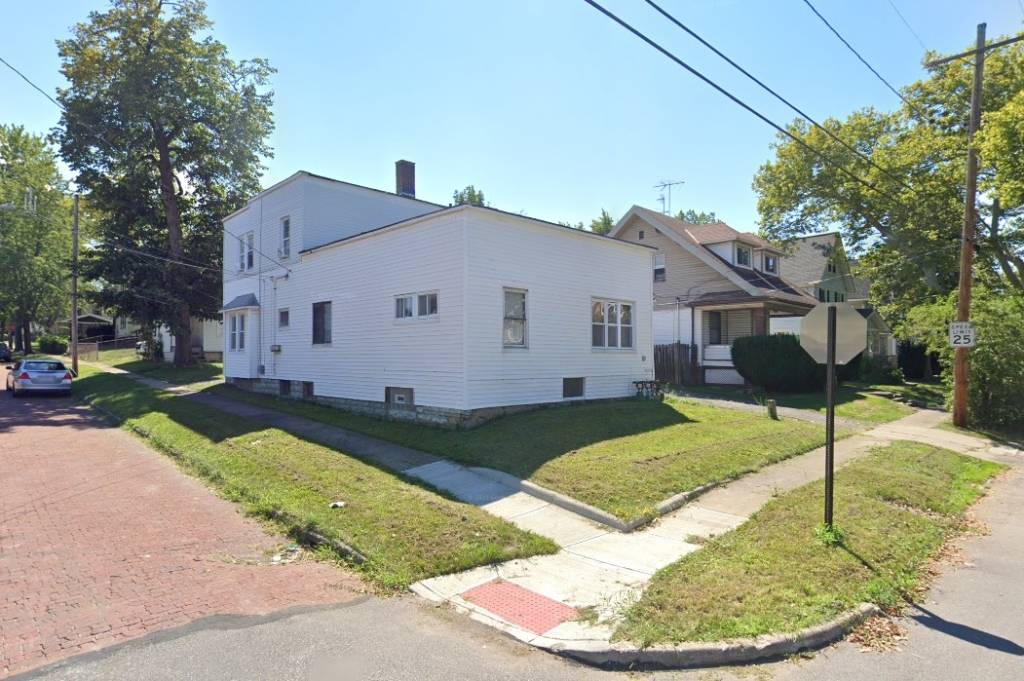
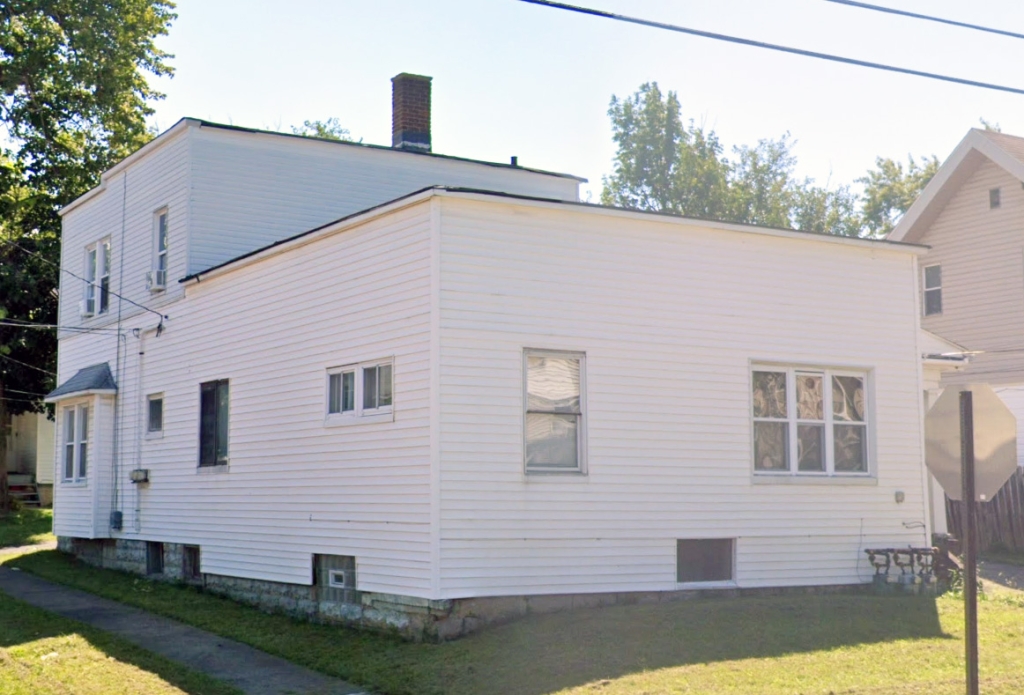
West 39th Street Cleveland, OH

RESERVE THIS PROPERTY

OFFERED BY THE SELLER

  • 6 Month Scope of Work Warranty if You Use the Preferred Property Management Company
  • 6 Month Rental Guarnatee if You Use the Preferred Property Management Company

Snapshot Financials

Price:
$ 420000
Rent:
$ 3975 / mo
Taxes:

Estimated Property Taxes

$ 333.083
Insurance:

Estimated Insurance

$ 135.417
HOA Fee:

Home Owners Association Fee

$ 0
PM Fee:

Property Management Fee

$ 398
"Utilities":
$ 200
"Landscaping":
$ 50
Vacancy:

Based on 7%

$ 278.25
Repairs:

Based on 5%

$ 198.75
Total:

Total Monthly Expenses

$ 1593.5
NOI:

Monthly Net Operating Income ('NOI') = Monthly Gross Scheduled Rent - Monthly Operating Expenses - 5% Maintenance Estimate - 7% Vacancy Estimates. NOI does not take into account any financing that you may be using. The NOI is always an 'estimate' and can never be guaranteed because it includes the non-fixed variables of 'maintenance' and 'vacancy' which vary over time.

$ 2382 / mo
Cap Rate:

Capitalization Rate ('Cap Rate') = Annual Net Operating Income / Purchase Price. Cap Rate does not take into account any financing you may be using nor any closing costs you may be paying.

6.8 %
GRM:

Gross Rent Multiplier ('GRM') = Purchase Price / Annual Gross Scheduled Rent. GRM is only a price to rent ratio and does not take into account any operating expenses, financing, closing cost payments or maintenance and vacancy assumptions. And remember, GRM is like a golf score, the lower the better.
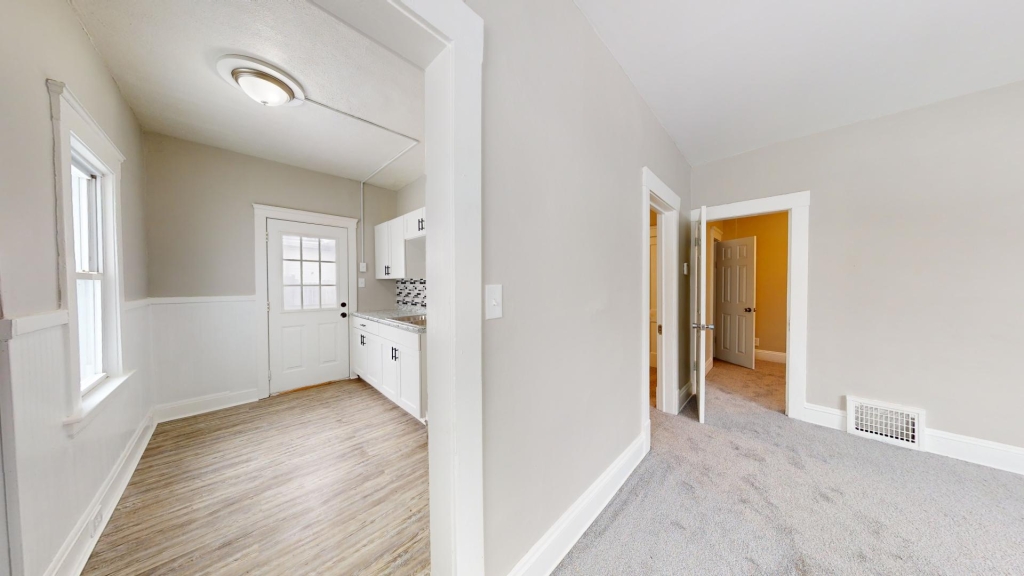
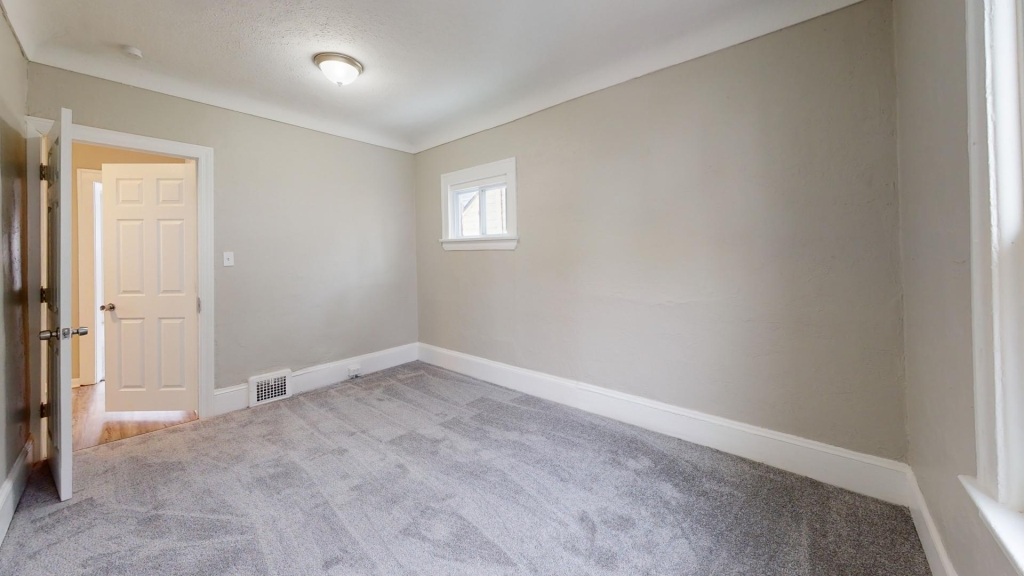
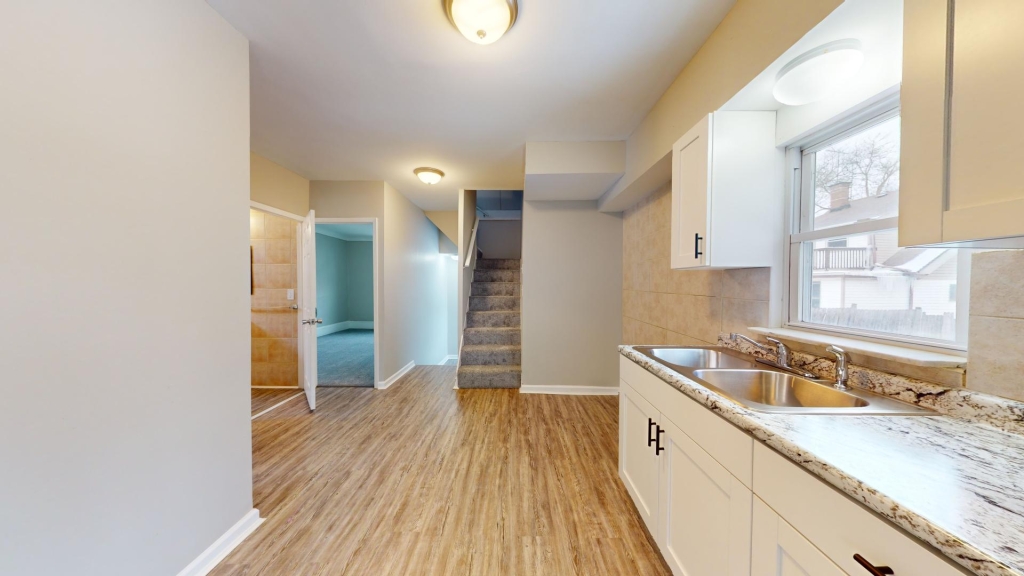
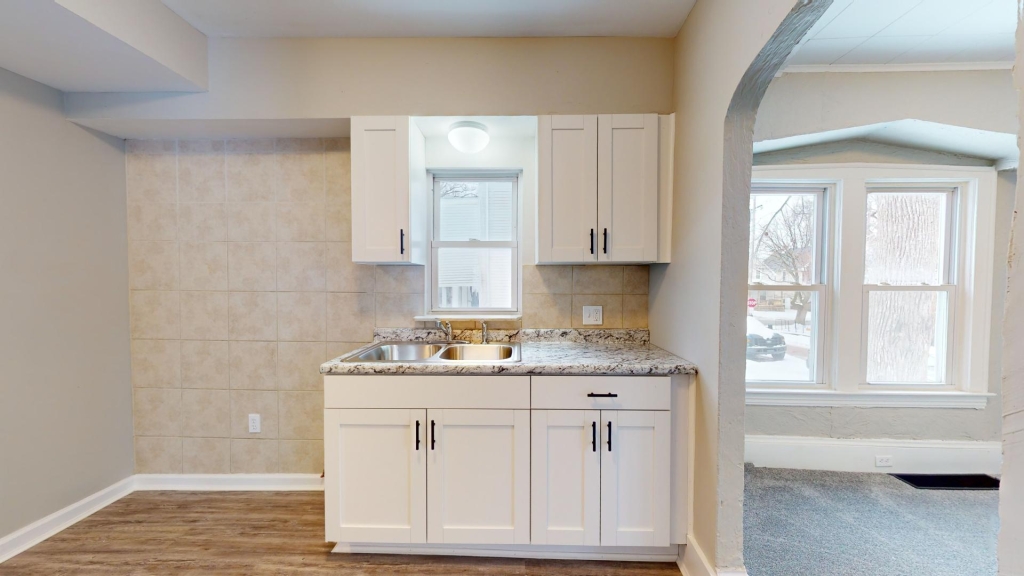
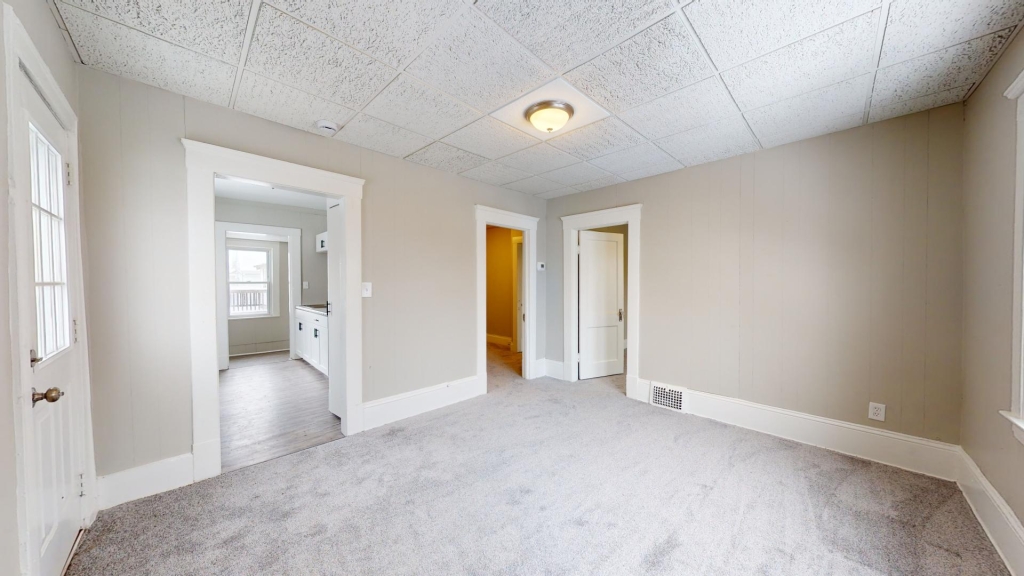
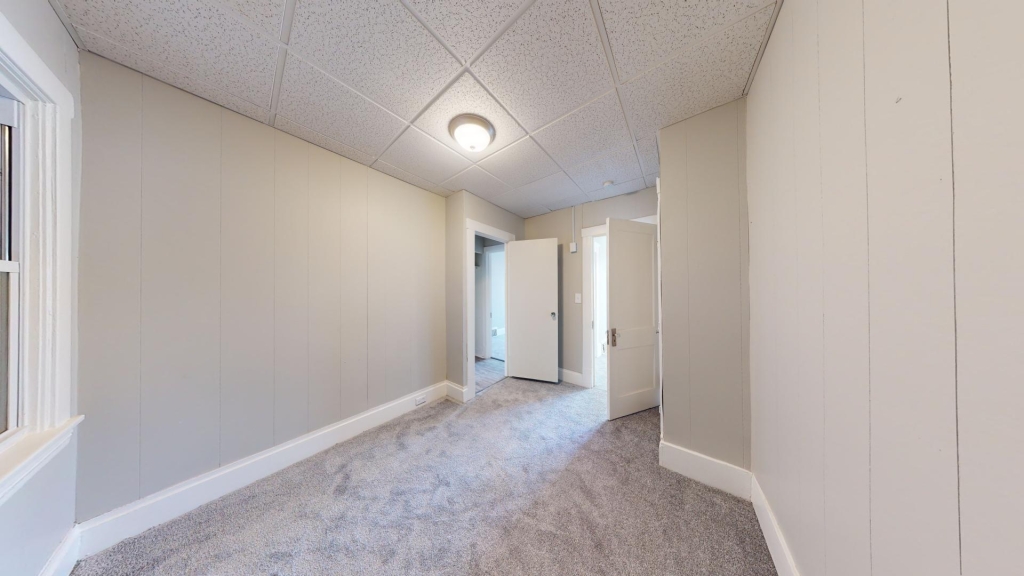
8.81

Property Features

Type:
Fourplex
Condition:
Fully Renovated as Condition of Closing
Rental Status:
Tenant in Place as Condition of Closing
Year Built:
1904
Bedrooms:
9
Bathrooms:
4.0
Floor Area:
1874 Sq Ft
Lot Size:
5,998 Sq Ft
Stories:
2 Stories
Basement:
Unknown
Parking:
Carport Parking
RESERVE THIS PROPERTY

Seller's Additional Notes

Additional Notes: 3Bed/1Bath SFH-$1,350, 2Bed/1Bath-$850, 2Bed/1Bath-$875, 2Bed/1Bath-$900
Seller recently had property appraised for $450,000 (appraisal available upon request during due diligence).

Cleveland Highlights

Cleveland Properties:

  • Fully-Renovated Single Family Homes
  • Tenants and Local Property Management in Place at Closing
  • 6.5% Average Cap Rate
  • $175,000 Average Purchase Price
  • Majority Owner-Occupied Communities

Cleveland Market:

  • Home Prices Appreciated over 10% in 2023
  • Cost of Living is 6% Below the National Average
  • Cost of Housing is 18% Below the National Average
  • Ranked Top 3 Hottest Real Estate Markets by Zillow
  • Ranked Top 20 Places in the WORLD to Visit by NatGeo

Similar
Properties

Maverick Property Vault

$841 Net Operating Income
$1778 Net Operating Income
$835 Net Operating Income
$1073 Net Operating Income
$2088 Net Operating Income
$925 Net Operating Income
No more properties to show

More Maverick Markets

Subscribe

    GET Access TO Private buying opportunities for TURNKEY Rental properies & EDUCATIONAL RESOURCES. READ OUR PRIVACY NOTICE & TERMS OF USE.

    Maverick's Cash-Flow Calculator

    DISCLAIMER
    OPEN

    This calculator is for recreational use only and is NOT financial or accounting software. There are a litany of variables that may be relevant to determining your individual tax obligations, financial performance and investment returns on a rental property that are NOT factored into this calculator. By using this calculator, you understand that the numbers herein are NOT specific projections of what your returns will actually be, and you agree that it is YOUR DUTY to consult with your own tax and financial professionals about the evaluation, risk assessment, realistic financial expectations, and actual tax obligations associated with any real estate investment. You also understand that ALL real estate investing involves risk, which buyer assumes 100%, and that no specific returns can ever be guaranteed by anyone.

    Top

    INSTRUCTIONS

    Click into any Investor INPUTS (THE ORANGE FIELDS) to modify.
    Click any field LABEL to view a definition.
    Click CALCULATE to update financial calculations on ALL TABS.
    Purchase
    Monthly Cashflow
    Tax Benefits
    Future Assumptions

    INSTRUCTIONS

    Click into any Investor INPUTS (THE ORANGE FIELDS) to modify.
    Click any field LABEL to view a definition.
    Click CALCULATE to update financial calculations on ALL TABS.
    Cash to Purchase
    Purchase Price
    $420,000
    Fair Market Value
    $420,000
    Down Payment Amount
    $84,000
    Depreciable Closing Costs
    $3,000
    Lender Fees / Points
    $3,000
    Total Cash Invested
    $90,000
    Total Equity at Purchase
    $84,000
    Morgage Calculation
    Loan Amount
    $336,000
    Monthly Mortgage Payment
    $1,804
    First Year Mortgage Principal Paid Down
    $4,957
    First Year Mortgage Interest Paid
    $16,687

    INSTRUCTIONS

    Click into any Investor INPUTS (THE ORANGE FIELDS) to modify.
    Click any field LABEL to view a definition.
    Click CALCULATE to update financial calculations on ALL TABS.
    First Year Monthly Cashflow
    Gross Scheduled Rent
    $3,975
    Vacancy Estimate
    $278
    Gross Operating Income
    $3,697
    Property Taxes
    $333
    Insurance
    $135
    Other Expense
    $0
    Owner-Paid Utilities / Landscaping
    $250
    Property Management Fee
    $398
    Maintenance Estimate
    $199
    Total Operating Expenses
    $1,314
    Net Operating Income (NOI)
    $2,383
    Mortgage Payment
    $1,804
    Cash Flow Before Taxes
    $579
    Gross Rent Multiplier (GRM)
    8.8
    Rent to Value Ratio (RV Ratio)
    0.9%
    Capitalization Rate (Cap Rate)
    6.8%
    Cash on Cash Return
    7.7%

    INSTRUCTIONS

    Click into any Investor INPUTS (THE ORANGE FIELDS) to modify.
    Click any field LABEL to view a definition.
    Click CALCULATE to update financial calculations on ALL TABS.
    Tax Benefits
    Value of (Non-Depreciable) Land
    $42,000
    Value of (Depreciable) Property Structure
    $378,000
    Depreciable "Cost Basis" at Purchase
    $381,000
    Annual Straight Line Depreciation of Cost Basis
    $13,855
    Annual Depreciation of Lender Fees / Costs
    $100
    First Year Total Depreciation
    $13,955
    First Year Taxable Income Before Depreciation
    $11,903
    First Year Taxable Income Offset by Depreciation
    $11,903
    First Year Remaining Taxable Income After Depreciation
    $0
    First Year Federal Income Taxes Owed on Rental Income
    $0
    First Year Tax Savings from Depreciation on Rental Income
    $3,809
    First Year Left Over Depreciation
    $2,052

    INSTRUCTIONS

    Click into any Investor INPUTS (THE ORANGE FIELDS) to modify.
    Click any field LABEL to view a definition.
    Click CALCULATE to update financial calculations on ALL TABS.
    (Swipe left or right to scroll horizontally)
    Annual Income
    Year 1Year 2Year 3Year 4Year 5Year 6Year 7Year 8Year 9Year 10Year 11Year 12Year 13Year 14Year 15Year 16Year 17Year 18Year 19Year 20Year 21Year 22Year 23Year 24Year 25Year 26Year 27Year 28Year 29Year 30
    Gross Scheduled Rent
    $47,700
    $48,654
    $49,627
    $50,620
    $51,632
    $52,665
    $53,718
    $54,792
    $55,888
    $57,006
    $58,146
    $59,309
    $60,495
    $61,705
    $62,939
    $64,198
    $65,482
    $66,792
    $68,127
    $69,490
    $70,880
    $72,297
    $73,743
    $75,218
    $76,722
    $78,257
    $79,822
    $81,418
    $83,047
    $84,708
    Vacancy Loss
    $3,339
    $3,406
    $3,474
    $3,543
    $3,614
    $3,687
    $3,760
    $3,835
    $3,912
    $3,990
    $4,070
    $4,152
    $4,235
    $4,319
    $4,406
    $4,494
    $4,584
    $4,675
    $4,769
    $4,864
    $4,962
    $5,061
    $5,162
    $5,265
    $5,371
    $5,478
    $5,588
    $5,699
    $5,813
    $5,930
    Gross Operating Income
    $44,361
    $45,248
    $46,153
    $47,076
    $48,018
    $48,978
    $49,958
    $50,957
    $51,976
    $53,016
    $54,076
    $55,157
    $56,260
    $57,386
    $58,533
    $59,704
    $60,898
    $62,116
    $63,358
    $64,626
    $65,918
    $67,236
    $68,581
    $69,953
    $71,352
    $72,779
    $74,235
    $75,719
    $77,234
    $78,778
    Annual Operating Expenses
    Year 1Year 2Year 3Year 4Year 5Year 6Year 7Year 8Year 9Year 10Year 11Year 12Year 13Year 14Year 15Year 16Year 17Year 18Year 19Year 20Year 21Year 22Year 23Year 24Year 25Year 26Year 27Year 28Year 29Year 30
    Property Taxes
    $3,996
    $3,996
    $3,996
    $3,996
    $3,996
    $3,996
    $3,996
    $3,996
    $3,996
    $3,996
    $3,996
    $3,996
    $3,996
    $3,996
    $3,996
    $3,996
    $3,996
    $3,996
    $3,996
    $3,996
    $3,996
    $3,996
    $3,996
    $3,996
    $3,996
    $3,996
    $3,996
    $3,996
    $3,996
    $3,996
    Insurance
    $1,620
    $1,620
    $1,620
    $1,620
    $1,620
    $1,620
    $1,620
    $1,620
    $1,620
    $1,620
    $1,620
    $1,620
    $1,620
    $1,620
    $1,620
    $1,620
    $1,620
    $1,620
    $1,620
    $1,620
    $1,620
    $1,620
    $1,620
    $1,620
    $1,620
    $1,620
    $1,620
    $1,620
    $1,620
    $1,620
    Maintenance Assumption
    $2,385
    $2,433
    $2,481
    $2,531
    $2,582
    $2,633
    $2,686
    $2,740
    $2,794
    $2,850
    $2,907
    $2,965
    $3,025
    $3,085
    $3,147
    $3,210
    $3,274
    $3,340
    $3,406
    $3,474
    $3,544
    $3,615
    $3,687
    $3,761
    $3,836
    $3,913
    $3,991
    $4,071
    $4,152
    $4,235
    Property Management
    $4,770
    $4,865
    $4,963
    $5,062
    $5,163
    $5,266
    $5,372
    $5,479
    $5,589
    $5,701
    $5,815
    $5,931
    $6,050
    $6,171
    $6,294
    $6,420
    $6,548
    $6,679
    $6,813
    $6,949
    $7,088
    $7,230
    $7,374
    $7,522
    $7,672
    $7,826
    $7,982
    $8,142
    $8,305
    $8,471
    Owner-Paid Utilities / Landscaping
    $3,000
    $3,000
    $3,000
    $3,000
    $3,000
    $3,000
    $3,000
    $3,000
    $3,000
    $3,000
    $3,000
    $3,000
    $3,000
    $3,000
    $3,000
    $3,000
    $3,000
    $3,000
    $3,000
    $3,000
    $3,000
    $3,000
    $3,000
    $3,000
    $3,000
    $3,000
    $3,000
    $3,000
    $3,000
    $3,000
    Other Expense
    $0
    $0
    $0
    $0
    $0
    $0
    $0
    $0
    $0
    $0
    $0
    $0
    $0
    $0
    $0
    $0
    $0
    $0
    $0
    $0
    $0
    $0
    $0
    $0
    $0
    $0
    $0
    $0
    $0
    $0
    Total Operating Expenses
    $15,771
    $15,914
    $16,060
    $16,209
    $16,361
    $16,516
    $16,674
    $16,835
    $16,999
    $17,167
    $17,338
    $17,512
    $17,690
    $17,872
    $18,057
    $18,246
    $18,438
    $18,635
    $18,835
    $19,039
    $19,248
    $19,461
    $19,677
    $19,899
    $20,124
    $20,355
    $20,589
    $20,829
    $21,073
    $21,322
    Annual Debt Service
    Year 1Year 2Year 3Year 4Year 5Year 6Year 7Year 8Year 9Year 10Year 11Year 12Year 13Year 14Year 15Year 16Year 17Year 18Year 19Year 20Year 21Year 22Year 23Year 24Year 25Year 26Year 27Year 28Year 29Year 30
    Debt Service
    $21,645
    $21,645
    $21,645
    $21,645
    $21,645
    $21,645
    $21,645
    $21,645
    $21,645
    $21,645
    $21,645
    $21,645
    $21,645
    $21,645
    $21,645
    $21,645
    $21,645
    $21,645
    $21,645
    $21,645
    $21,645
    $21,645
    $21,645
    $21,645
    $21,645
    $21,645
    $21,645
    $21,645
    $21,645
    $21,645
    Mortgage Balance at Year End
    $331,043
    $325,832
    $320,354
    $314,597
    $308,545
    $302,183
    $295,495
    $288,466
    $281,077
    $273,309
    $265,145
    $256,562
    $247,541
    $238,058
    $228,090
    $217,612
    $206,598
    $195,020
    $182,850
    $170,057
    $156,610
    $142,475
    $127,617
    $111,998
    $95,580
    $78,323
    $60,182
    $41,114
    $21,070
    -
    Debt Service Coverage Ratio
    1.32%
    1.36%
    1.39%
    1.43%
    1.46%
    1.5%
    1.54%
    1.58%
    1.62%
    1.66%
    1.7%
    1.74%
    1.78%
    1.83%
    1.87%
    1.92%
    1.96%
    2.01%
    2.06%
    2.11%
    2.16%
    2.21%
    2.26%
    2.31%
    2.37%
    2.42%
    2.48%
    2.54%
    2.59%
    2.65%
    Annual Capital Improvements
    Year 1Year 2Year 3Year 4Year 5Year 6Year 7Year 8Year 9Year 10Year 11Year 12Year 13Year 14Year 15Year 16Year 17Year 18Year 19Year 20Year 21Year 22Year 23Year 24Year 25Year 26Year 27Year 28Year 29Year 30
    Capital Improvements
    $0
    $0
    $0
    $0
    $0
    $0
    $0
    $0
    $0
    $0
    $0
    $0
    $0
    $0
    $0
    $0
    $0
    $0
    $0
    $0
    $0
    $0
    $0
    $0
    $0
    $0
    $0
    $0
    $0
    $0
    Annual Cash Flow Analysis
    Year 1Year 2Year 3Year 4Year 5Year 6Year 7Year 8Year 9Year 10Year 11Year 12Year 13Year 14Year 15Year 16Year 17Year 18Year 19Year 20Year 21Year 22Year 23Year 24Year 25Year 26Year 27Year 28Year 29Year 30
    Net Operating Income
    $28,590
    $29,334
    $30,093
    $30,867
    $31,657
    $32,462
    $33,284
    $34,122
    $34,977
    $35,849
    $36,738
    $37,645
    $38,570
    $39,514
    $40,477
    $41,458
    $42,460
    $43,481
    $44,523
    $45,586
    $46,670
    $47,776
    $48,904
    $50,054
    $51,228
    $52,424
    $53,645
    $54,890
    $56,161
    $57,456
    Capitalization Rate
    6.8%
    7%
    7.2%
    7.3%
    7.5%
    7.7%
    7.9%
    8.1%
    8.3%
    8.5%
    8.7%
    9%
    9.2%
    9.4%
    9.6%
    9.9%
    10.1%
    10.4%
    10.6%
    10.9%
    11.1%
    11.4%
    11.6%
    11.9%
    12.2%
    12.5%
    12.8%
    13.1%
    13.4%
    13.7%
    Cash Flow Before Taxes
    $6,945
    $7,689
    $8,448
    $9,223
    $10,012
    $10,818
    $11,639
    $12,477
    $13,332
    $14,204
    $15,093
    $16,000
    $16,926
    $17,869
    $18,832
    $19,814
    $20,815
    $21,837
    $22,879
    $23,941
    $25,026
    $26,131
    $27,259
    $28,409
    $29,583
    $30,780
    $32,001
    $33,246
    $34,516
    $35,811
    Cash on Cash Return
    7.7%
    8.5%
    9.4%
    10.2%
    11.1%
    12%
    12.9%
    13.9%
    14.8%
    15.8%
    16.8%
    17.8%
    18.8%
    19.9%
    20.9%
    22%
    23.1%
    24.3%
    25.4%
    26.6%
    27.8%
    29%
    30.3%
    31.6%
    32.9%
    34.2%
    35.6%
    36.9%
    38.4%
    39.8%
    Annual Equity Accumulation
    Year 1Year 2Year 3Year 4Year 5Year 6Year 7Year 8Year 9Year 10Year 11Year 12Year 13Year 14Year 15Year 16Year 17Year 18Year 19Year 20Year 21Year 22Year 23Year 24Year 25Year 26Year 27Year 28Year 29Year 30
    Property Appreciation
    $16,800
    $17,472
    $18,171
    $18,898
    $19,654
    $20,440
    $21,257
    $22,108
    $22,992
    $23,912
    $24,868
    $25,863
    $26,897
    $27,973
    $29,092
    $30,256
    $31,466
    $32,725
    $34,034
    $35,395
    $36,811
    $38,283
    $39,815
    $41,407
    $43,064
    $44,786
    $46,577
    $48,441
    $50,378
    $52,393
    Mortgage Principal Pay Down
    $4,957
    $5,211
    $5,477
    $5,758
    $6,052
    $6,362
    $6,687
    $7,030
    $7,389
    $7,767
    $8,165
    $8,582
    $9,021
    $9,483
    $9,968
    $10,478
    $11,014
    $11,578
    $12,170
    $12,793
    $13,447
    $14,135
    $14,858
    $15,619
    $16,418
    $17,258
    $18,140
    $19,069
    $20,044
    $21,070
    Total Equity Growth
    $21,757
    $22,683
    $23,648
    $24,655
    $25,706
    $26,802
    $27,945
    $29,137
    $30,381
    $31,679
    $33,033
    $34,445
    $35,919
    $37,456
    $39,060
    $40,734
    $42,480
    $44,302
    $46,204
    $48,188
    $50,258
    $52,418
    $54,673
    $57,026
    $59,481
    $62,044
    $64,718
    $67,509
    $70,422
    $73,463
    Annual Tax Savings From Depreciation
    Year 1Year 2Year 3Year 4Year 5Year 6Year 7Year 8Year 9Year 10Year 11Year 12Year 13Year 14Year 15Year 16Year 17Year 18Year 19Year 20Year 21Year 22Year 23Year 24Year 25Year 26Year 27Year 28Year 29Year 30
    Straight Line Depreciation of Cost Basis
    $13,955
    $13,955
    $13,955
    $13,955
    $13,955
    $13,955
    $13,955
    $13,955
    $13,955
    $13,955
    $13,955
    $13,955
    $13,955
    $13,955
    $13,955
    $13,955
    $13,955
    $13,955
    $13,955
    $13,955
    $13,955
    $13,955
    $13,955
    $13,955
    $13,955
    $13,955
    $13,955
    $6,977
    $0
    $0
    Straight Line Depreciaiton of Lender Fees / Points
    $100
    $100
    $100
    $100
    $100
    $100
    $100
    $100
    $100
    $100
    $100
    $100
    $100
    $100
    $100
    $100
    $100
    $100
    $100
    $100
    $100
    $100
    $100
    $100
    $100
    $100
    $100
    $100
    $100
    $100
    Total Straight Line Depreciation
    $14,055
    $14,055
    $14,055
    $14,055
    $14,055
    $14,055
    $14,055
    $14,055
    $14,055
    $14,055
    $14,055
    $14,055
    $14,055
    $14,055
    $14,055
    $14,055
    $14,055
    $14,055
    $14,055
    $14,055
    $14,055
    $14,055
    $14,055
    $14,055
    $14,055
    $14,055
    $14,055
    $7,077
    $100
    $100
    Taxable Income Before Depreciation
    $11,903
    $12,900
    $13,926
    $14,980
    $16,065
    $17,180
    $18,327
    $19,507
    $20,721
    $21,971
    $23,258
    $24,583
    $25,947
    $27,352
    $28,800
    $30,292
    $31,829
    $33,414
    $35,049
    $36,734
    $38,473
    $40,266
    $42,117
    $44,028
    $46,000
    $48,037
    $50,141
    $52,314
    $54,560
    $56,881
    Carry Forward Loss From Depreciation
    $2,152
    $3,306
    $3,435
    $2,509
    $499
    $0
    $0
    $0
    $0
    $0
    $0
    $0
    $0
    $0
    $0
    $0
    $0
    $0
    $0
    $0
    $0
    $0
    $0
    $0
    $0
    $0
    $0
    $0
    $0
    $0
    Taxable Income Offset by Depreciation
    $11,903
    $12,900
    $13,926
    $14,980
    $16,065
    $14,554
    $14,055
    $14,055
    $14,055
    $14,055
    $14,055
    $14,055
    $14,055
    $14,055
    $14,055
    $14,055
    $14,055
    $14,055
    $14,055
    $14,055
    $14,055
    $14,055
    $14,055
    $14,055
    $14,055
    $14,055
    $14,055
    $7,077
    $100
    $100
    Remaining Taxable Income After Depreciation
    $0
    $0
    $0
    $0
    $0
    $2,626
    $4,272
    $5,452
    $6,667
    $7,917
    $9,203
    $10,528
    $11,892
    $13,298
    $14,745
    $16,237
    $17,775
    $19,360
    $20,994
    $22,680
    $24,418
    $26,212
    $28,063
    $29,973
    $31,946
    $33,983
    $36,086
    $45,237
    $54,460
    $56,781
    Federal Income Tax Owed on Rental Income
    $0
    $0
    $0
    $0
    $0
    $840
    $1,367
    $1,745
    $2,133
    $2,533
    $2,945
    $3,369
    $3,806
    $4,255
    $4,719
    $5,196
    $5,688
    $6,195
    $6,718
    $7,257
    $7,814
    $8,388
    $8,980
    $9,592
    $10,223
    $10,874
    $11,548
    $14,476
    $17,427
    $18,170
    Tax Savings from Depreciation
    $3,809
    $4,128
    $4,456
    $4,794
    $5,141
    $4,657
    $4,497
    $4,497
    $4,497
    $4,497
    $4,497
    $4,497
    $4,497
    $4,497
    $4,497
    $4,497
    $4,497
    $4,497
    $4,497
    $4,497
    $4,497
    $4,497
    $4,497
    $4,497
    $4,497
    $4,497
    $4,497
    $2,265
    $32
    $32
    Cash Flow After Taxes
    $6,945
    $7,689
    $8,448
    $9,223
    $10,012
    $9,977
    $10,272
    $10,733
    $11,199
    $11,671
    $12,148
    $12,631
    $13,120
    $13,614
    $14,113
    $14,618
    $15,127
    $15,642
    $16,161
    $16,684
    $17,212
    $17,743
    $18,279
    $18,818
    $19,360
    $19,905
    $20,453
    $18,770
    $17,089
    $17,641
    Performance Over Time
    Year 1Year 2Year 3Year 4Year 5Year 6Year 7Year 8Year 9Year 10Year 11Year 12Year 13Year 14Year 15Year 16Year 17Year 18Year 19Year 20Year 21Year 22Year 23Year 24Year 25Year 26Year 27Year 28Year 29Year 30
    Fair Market Property Value at Year End
    $436,800
    $454,272
    $472,443
    $491,341
    $510,994
    $531,434
    $552,691
    $574,799
    $597,791
    $621,703
    $646,571
    $672,434
    $699,331
    $727,304
    $756,396
    $786,652
    $818,118
    $850,843
    $884,877
    $920,272
    $957,083
    $995,366
    $1,035,181
    $1,076,588
    $1,119,651
    $1,164,437
    $1,211,015
    $1,259,455
    $1,309,834
    $1,362,227
    Cumulative Appreciation
    $16,800
    $34,272
    $52,443
    $71,341
    $90,994
    $111,434
    $132,691
    $154,799
    $177,791
    $201,703
    $226,571
    $252,434
    $279,331
    $307,304
    $336,396
    $366,652
    $398,118
    $430,843
    $464,877
    $500,272
    $537,083
    $575,366
    $615,181
    $656,588
    $699,651
    $744,437
    $791,015
    $839,455
    $889,834
    $942,227
    Cumulative Mortgage Principal Paydown
    $4,957
    $10,168
    $15,646
    $21,403
    $27,455
    $33,817
    $40,505
    $47,534
    $54,923
    $62,691
    $70,855
    $79,438
    $88,459
    $97,942
    $107,910
    $118,388
    $129,402
    $140,980
    $153,150
    $165,943
    $179,390
    $193,525
    $208,383
    $224,002
    $240,420
    $257,677
    $275,818
    $294,886
    $314,930
    $336,000
    Total Cumulative Equity
    $105,757
    $128,440
    $152,088
    $176,744
    $202,450
    $229,251
    $257,196
    $286,333
    $316,714
    $348,393
    $381,426
    $415,871
    $451,790
    $489,246
    $528,306
    $569,040
    $611,521
    $655,823
    $702,027
    $750,215
    $800,473
    $852,891
    $907,564
    $964,590
    $1,024,071
    $1,086,114
    $1,150,832
    $1,218,342
    $1,288,764
    $1,362,227
    Cumulative Cash Flow Before Taxes
    $6,945
    $14,635
    $23,083
    $32,306
    $42,318
    $53,136
    $64,775
    $77,253
    $90,585
    $104,789
    $119,882
    $135,882
    $152,808
    $170,677
    $189,509
    $209,323
    $230,138
    $251,975
    $274,854
    $298,795
    $323,820
    $349,952
    $377,211
    $405,620
    $435,203
    $465,983
    $497,983
    $531,229
    $565,745
    $601,557
    Cumulative Tax Savings From Depreciation
    $3,809
    $7,937
    $12,393
    $17,187
    $22,328
    $26,985
    $31,482
    $35,980
    $40,477
    $44,975
    $49,472
    $53,969
    $58,467
    $62,964
    $67,462
    $71,959
    $76,457
    $80,954
    $85,452
    $89,949
    $94,447
    $98,944
    $103,441
    $107,939
    $112,436
    $116,934
    $121,431
    $123,696
    $123,728
    $123,760
    Cumulative Cash Flow After Taxes
    $6,945
    $14,635
    $23,083
    $32,306
    $42,318
    $52,296
    $62,568
    $73,301
    $84,499
    $96,170
    $108,318
    $120,949
    $134,069
    $147,683
    $161,797
    $176,415
    $191,542
    $207,183
    $223,344
    $240,028
    $257,240
    $274,983
    $293,262
    $312,080
    $331,440
    $351,345
    $371,798
    $390,568
    $407,657
    $425,298
    Total Net Profit if Sold
    -
    $16,733
    $47,376
    $79,743
    $113,888
    $149,032
    $185,549
    $223,650
    $263,390
    $304,827
    $348,018
    $393,026
    $439,913
    $488,745
    $539,591
    $592,523
    $647,613
    $704,939
    $764,581
    $826,621
    $891,146
    $958,245
    $1,028,012
    $1,100,543
    $1,175,939
    $1,254,305
    $1,335,750
    $1,418,153
    $1,501,634
    $1,588,547
    Total Return on Investment if Sold
    -
    18.59%
    52.64%
    88.6%
    126.54%
    165.59%
    206.17%
    248.5%
    292.66%
    338.7%
    386.69%
    436.7%
    488.79%
    543.05%
    599.55%
    658.36%
    719.57%
    783.27%
    849.53%
    918.47%
    990.16%
    1064.72%
    1142.24%
    1222.83%
    1306.6%
    1393.67%
    1484.17%
    1575.73%
    1668.48%
    1765.05%
    Before-Tax Return on Investment if Held
    31.9%
    33.7%
    35.7%
    37.6%
    39.7%
    41.8%
    44%
    46.2%
    48.6%
    51%
    53.5%
    56.1%
    58.7%
    61.5%
    64.3%
    67.3%
    70.3%
    73.5%
    76.8%
    80.1%
    83.6%
    87.3%
    91%
    94.9%
    99%
    103.1%
    107.5%
    111.9%
    116.6%
    121.4%
    After-Tax Return on Investment if Held
    31.9%
    33.7%
    35.7%
    37.6%
    39.7%
    40.9%
    42.5%
    44.3%
    46.2%
    48.2%
    50.2%
    52.3%
    54.5%
    56.7%
    59.1%
    61.5%
    64%
    66.6%
    69.3%
    72.1%
    75%
    78%
    81.1%
    84.3%
    87.6%
    91.1%
    94.6%
    95.9%
    97.2%
    101.2%
    Internal Rate of Return (IRR)
    -
    9.2%
    16.2%
    18.8%
    19.8%
    20.2%
    20.2%
    20%
    19.8%
    19.5%
    19.3%
    19%
    18.7%
    18.4%
    18.2%
    17.9%
    17.7%
    17.5%
    17.3%
    17.1%
    16.9%
    16.8%
    16.6%
    16.5%
    16.3%
    16.2%
    16.1%
    16%
    15.9%
    15.8%