Own Cash-Flowing Rental Properties in the Best U.S. Markets From Anywhere!

Welcome to Wichita!

ABOUT Wichita

Wichita, Kansas is a smaller market with big advantages over larger metro areas. Unlike big cities where Wall Street firms have driven up prices, Wichita’s cost of housing is still 34% below the national average and the rent-to-value ratios remain strong. It is also a regional economic hub anchored by world-class aerospace and advanced manufacturing employers with a steadily growing population. Wichita’s housing market continues to appreciate year over year, showing consistent growth without the wild swings seen on the coasts. On top of that, Wichita’s overall cost of living is 11% lower than the national average.

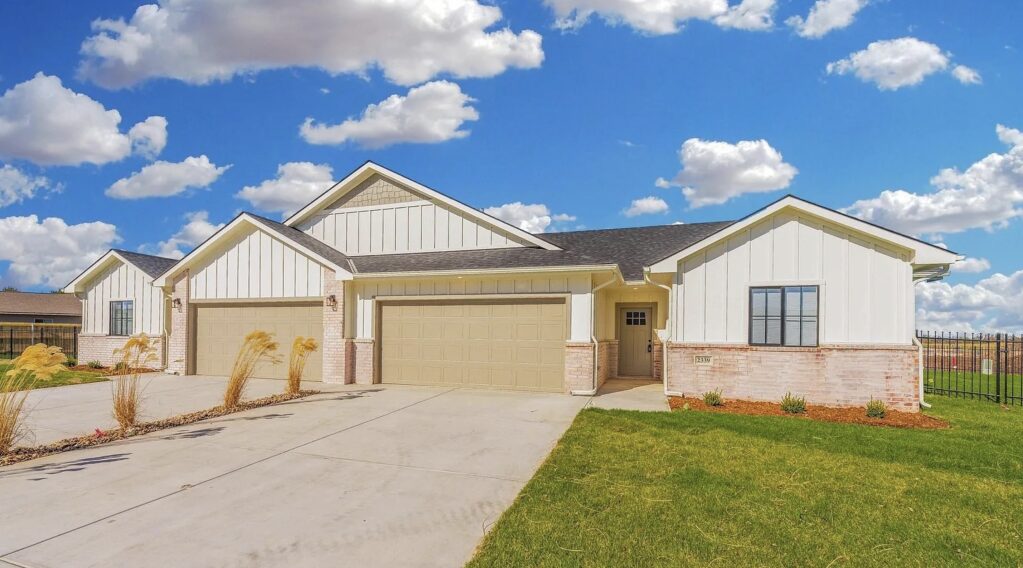
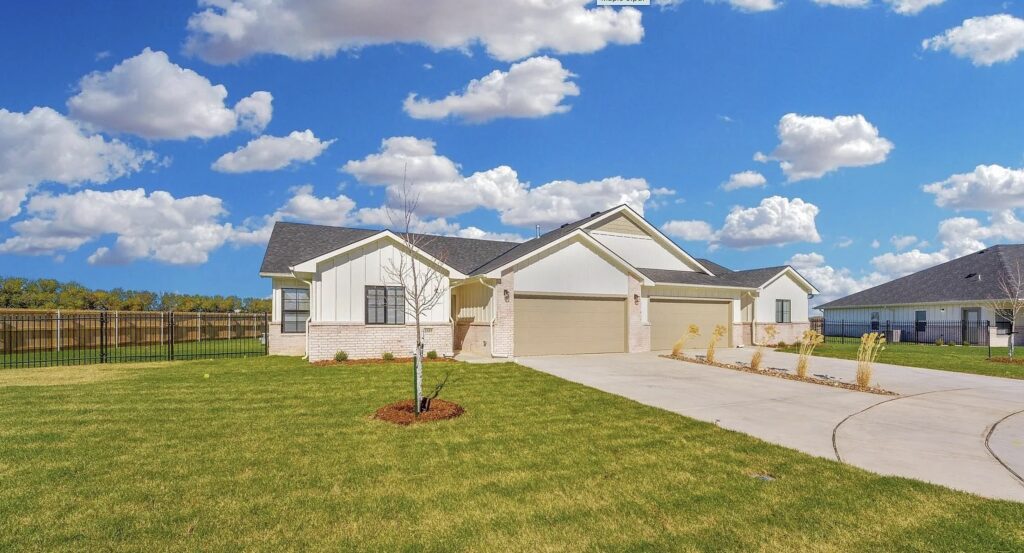
Spring Hill Ct Goddard, KS

RESERVE THIS PROPERTY

OFFERED BY THE SELLER

  • 1 Year Builder Warranty
  • Manufacturer Warranties
  • 1 Year No HOA Fees
  • 1 Year Free Property Management (with use of Seller’s PM)

Snapshot Financials

Price:
$ 217500
Rent:
$ 1645 / mo
Taxes:

Estimated Property Taxes

$ 183.333
Insurance:

Estimated Insurance

$ 66.6667
HOA Fee:

Home Owners Association Fee

$ 125
PM Fee:

Property Management Fee

$ 65.8
Other:
$ 0
Other:
$ 0
Vacancy:

Based on 5%

$ 82.25
Repairs:

Based on 4%

$ 65.8
Total:

Total Monthly Expenses

$ 588.85
NOI:

Monthly Net Operating Income ('NOI') = Monthly Gross Scheduled Rent - Monthly Operating Expenses - 5% Maintenance Estimate - 7% Vacancy Estimates. NOI does not take into account any financing that you may be using. The NOI is always an 'estimate' and can never be guaranteed because it includes the non-fixed variables of 'maintenance' and 'vacancy' which vary over time.

$ 1,056 / mo
Cap Rate:

Capitalization Rate ('Cap Rate') = Annual Net Operating Income / Purchase Price. Cap Rate does not take into account any financing you may be using nor any closing costs you may be paying.

5.8 %
GRM:

Gross Rent Multiplier ('GRM') = Purchase Price / Annual Gross Scheduled Rent. GRM is only a price to rent ratio and does not take into account any operating expenses, financing, closing cost payments or maintenance and vacancy assumptions. And remember, GRM is like a golf score, the lower the better.

11.02

Property Features

Type:
Townhouse
Condition:
New Construction
Rental Status:
Currently Rented
Year Built:
2025
Bedrooms:
3
Bathrooms:
2.0
Floor Area:
1216 Sq Ft
Lot Size:
TBD
Stories:
1 Story
Basement:
n/a
Parking:
2 Car Garage
RESERVE THIS PROPERTY
Agent Reservation

Seller's Additional Notes

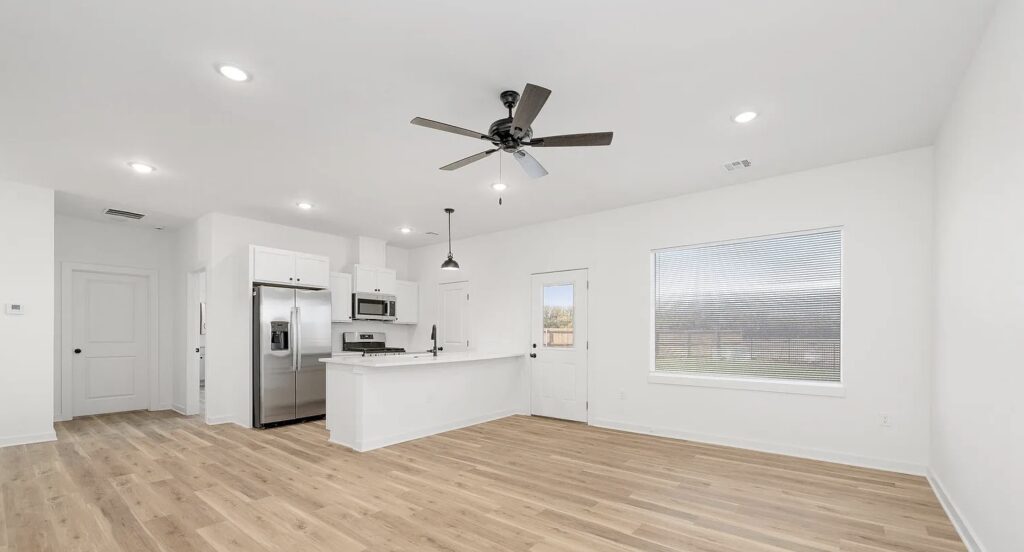
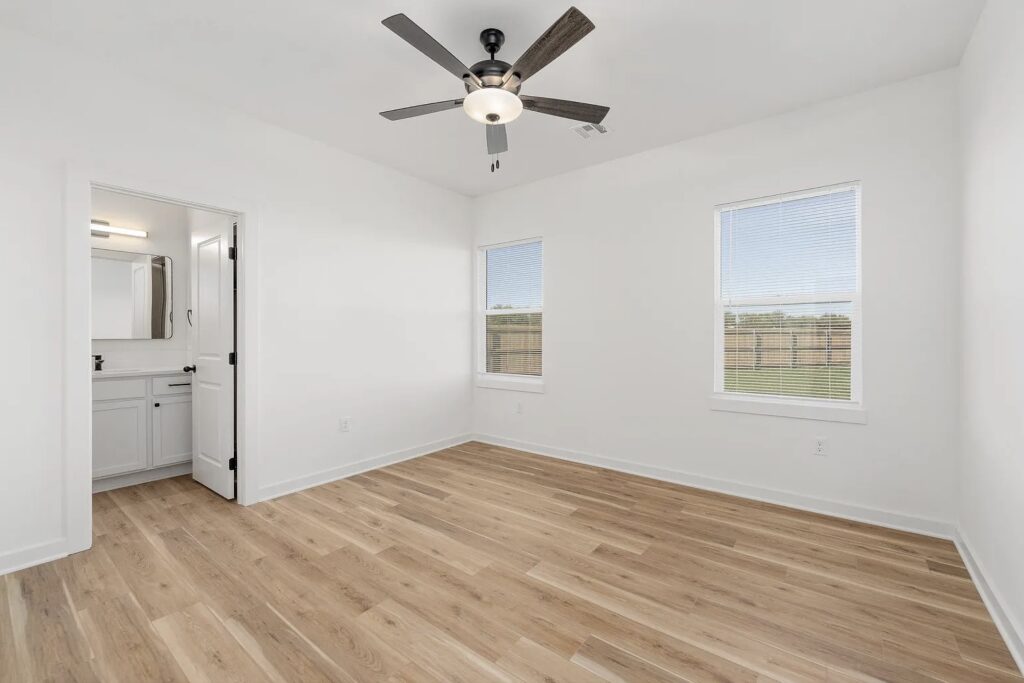
Brand new single duplex unit. Class A property located in affluent suburb of Wichita, Kansas. Interior finishes consist of quartz countertops, stainless steel appliances, upgraded lighting, lvt floorting and many other upgrades. Backyard is fenced with high quality rod iron fencing. Neighborhood amenities (clubhouse, pool, walking trails, water features and sport court) are under construction and will be completed Spring of 2026. These units are currently leased.

Wichita Highlights

Wichita Properties:

  • New Construction Duplexes and Townhomes in Class A Neighborhoods
  • Quartz Countertops and Stainless Steel Appliances
  • Tenants and Local Property Management in Place
  • 5.5%+ Average Cap Rates
  • $217,500 Starting Purchase Price

Wichita Market:

  • Cost of living 11% below the national average
  • Cost of housing 34% below the national average.
  • Economy anchored by world-class aerospace and manufacturing companies
  • Ranked #1 MSA for % of “very high-tech” manufacturing jobs
  • Excellent K-12 school districts that consistently attract families.

Similar
Properties

Maverick Property Vault

$1,091 Net Operating Income
$1,174 Net Operating Income
$2,075 Net Operating Income
$1,079 Net Operating Income
$2,116 Net Operating Income
$2,046 Net Operating Income
No more properties to show

More Maverick Markets

Subscribe

    GET Access TO Private buying opportunities for TURNKEY Rental properies & EDUCATIONAL RESOURCES. READ OUR PRIVACY NOTICE & TERMS OF USE.

    Maverick's Cash-Flow Calculator

    DISCLAIMER
    OPEN

    This calculator is for recreational use only and is NOT financial or accounting software. There are a litany of variables that may be relevant to determining your individual tax obligations, financial performance and investment returns on a rental property that are NOT factored into this calculator. By using this calculator, you understand that the numbers herein are NOT specific projections of what your returns will actually be, and you agree that it is YOUR DUTY to consult with your own tax and financial professionals about the evaluation, risk assessment, realistic financial expectations, and actual tax obligations associated with any real estate investment. You also understand that ALL real estate investing involves risk, which buyer assumes 100%, and that no specific returns can ever be guaranteed by anyone.

    Top

    INSTRUCTIONS

    Click into any Investor INPUTS (THE ORANGE FIELDS) to modify.
    Click CALCULATE to update financial calculations on ALL TABS.
    Click any field LABEL to view a definition.
    Purchase
    Monthly Cashflow
    Tax Benefits
    Future Assumptions

    INSTRUCTIONS

    Click any field LABEL to view a definition.
    Cash to Purchase
    Purchase Price
    $217,500
    Fair Market Value
    $225,000
    Down Payment Amount
    $43,500
    Depreciable Closing Costs
    $3,000
    Lender Fees / Points
    $3,000
    Total Cash Invested
    $49,500
    Total Equity at Purchase
    $51,000
    Morgage Calculation
    Loan Amount
    $174,000
    Monthly Mortgage Payment
    $934
    First Year Mortgage Principal Paid Down
    $2,567
    First Year Mortgage Interest Paid
    $8,642

    INSTRUCTIONS

    Click any field LABEL to view a definition.
    First Year Monthly Cashflow
    Gross Scheduled Rent
    $1,645
    Vacancy Estimate
    $82
    Gross Operating Income
    $1,563
    Property Taxes
    $183
    Insurance
    $67
    Other Expense
    $125
    Owner-Paid Utilities / Landscaping
    $0
    Property Management Fee
    $66
    Maintenance Estimate
    $66
    Total Operating Expenses
    $507
    Net Operating Income (NOI)
    $1,056
    Mortgage Payment
    $934
    Cash Flow Before Taxes
    $122
    Gross Rent Multiplier (GRM)
    11
    Rent to Value Ratio (RV Ratio)
    0.8%
    Capitalization Rate (Cap Rate)
    5.8%
    Cash on Cash Return
    3%

    INSTRUCTIONS

    Click any field LABEL to view a definition.
    Tax Benefits
    Value of (Non-Depreciable) Land
    $21,750
    Value of (Depreciable) Property Structure
    $195,750
    Depreciable "Cost Basis" at Purchase
    $198,750
    Annual Straight Line Depreciation of Cost Basis
    $7,227
    Annual Depreciation of Lender Fees / Costs
    $100
    First Year Total Depreciation
    $7,327
    First Year Taxable Income Before Depreciation
    $4,032
    First Year Taxable Income Offset by Depreciation
    $4,032
    First Year Remaining Taxable Income After Depreciation
    $0
    First Year Federal Income Taxes Owed on Rental Income
    $0
    First Year Tax Savings from Depreciation on Rental Income
    $1,290
    First Year Left Over Depreciation
    $3,295

    INSTRUCTIONS

    Click any field LABEL to view a definition.
    (Swipe left or right to scroll horizontally)
    Annual Income
    Year 1Year 2Year 3Year 4Year 5Year 6Year 7Year 8Year 9Year 10Year 11Year 12Year 13Year 14Year 15Year 16Year 17Year 18Year 19Year 20Year 21Year 22Year 23Year 24Year 25Year 26Year 27Year 28Year 29Year 30
    Gross Scheduled Rent
    $19,740
    $20,135
    $20,537
    $20,948
    $21,367
    $21,795
    $22,230
    $22,675
    $23,129
    $23,591
    $24,063
    $24,544
    $25,035
    $25,536
    $26,047
    $26,567
    $27,099
    $27,641
    $28,194
    $28,757
    $29,333
    $29,919
    $30,518
    $31,128
    $31,751
    $32,386
    $33,033
    $33,694
    $34,368
    $35,055
    Vacancy Loss
    $987
    $1,007
    $1,027
    $1,047
    $1,068
    $1,090
    $1,112
    $1,134
    $1,156
    $1,180
    $1,203
    $1,227
    $1,252
    $1,277
    $1,302
    $1,328
    $1,355
    $1,382
    $1,410
    $1,438
    $1,467
    $1,496
    $1,526
    $1,556
    $1,588
    $1,619
    $1,652
    $1,685
    $1,718
    $1,753
    Gross Operating Income
    $18,753
    $19,128
    $19,511
    $19,901
    $20,299
    $20,705
    $21,119
    $21,541
    $21,972
    $22,412
    $22,860
    $23,317
    $23,783
    $24,259
    $24,744
    $25,239
    $25,744
    $26,259
    $26,784
    $27,320
    $27,866
    $28,423
    $28,992
    $29,572
    $30,163
    $30,766
    $31,382
    $32,009
    $32,649
    $33,302
    Annual Operating Expenses
    Year 1Year 2Year 3Year 4Year 5Year 6Year 7Year 8Year 9Year 10Year 11Year 12Year 13Year 14Year 15Year 16Year 17Year 18Year 19Year 20Year 21Year 22Year 23Year 24Year 25Year 26Year 27Year 28Year 29Year 30
    Property Taxes
    $2,196
    $2,196
    $2,196
    $2,196
    $2,196
    $2,196
    $2,196
    $2,196
    $2,196
    $2,196
    $2,196
    $2,196
    $2,196
    $2,196
    $2,196
    $2,196
    $2,196
    $2,196
    $2,196
    $2,196
    $2,196
    $2,196
    $2,196
    $2,196
    $2,196
    $2,196
    $2,196
    $2,196
    $2,196
    $2,196
    Insurance
    $804
    $804
    $804
    $804
    $804
    $804
    $804
    $804
    $804
    $804
    $804
    $804
    $804
    $804
    $804
    $804
    $804
    $804
    $804
    $804
    $804
    $804
    $804
    $804
    $804
    $804
    $804
    $804
    $804
    $804
    Maintenance Assumption
    $790
    $805
    $821
    $838
    $855
    $872
    $889
    $907
    $925
    $944
    $963
    $982
    $1,001
    $1,021
    $1,042
    $1,063
    $1,084
    $1,106
    $1,128
    $1,150
    $1,173
    $1,197
    $1,221
    $1,245
    $1,270
    $1,295
    $1,321
    $1,348
    $1,375
    $1,402
    Property Management
    $790
    $805
    $821
    $838
    $855
    $872
    $889
    $907
    $925
    $944
    $963
    $982
    $1,001
    $1,021
    $1,042
    $1,063
    $1,084
    $1,106
    $1,128
    $1,150
    $1,173
    $1,197
    $1,221
    $1,245
    $1,270
    $1,295
    $1,321
    $1,348
    $1,375
    $1,402
    Owner-Paid Utilities / Landscaping
    $0
    $0
    $0
    $0
    $0
    $0
    $0
    $0
    $0
    $0
    $0
    $0
    $0
    $0
    $0
    $0
    $0
    $0
    $0
    $0
    $0
    $0
    $0
    $0
    $0
    $0
    $0
    $0
    $0
    $0
    Other Expense
    $1,500
    $1,500
    $1,500
    $1,500
    $1,500
    $1,500
    $1,500
    $1,500
    $1,500
    $1,500
    $1,500
    $1,500
    $1,500
    $1,500
    $1,500
    $1,500
    $1,500
    $1,500
    $1,500
    $1,500
    $1,500
    $1,500
    $1,500
    $1,500
    $1,500
    $1,500
    $1,500
    $1,500
    $1,500
    $1,500
    Total Operating Expenses
    $6,079
    $6,111
    $6,143
    $6,176
    $6,209
    $6,244
    $6,278
    $6,314
    $6,350
    $6,387
    $6,425
    $6,464
    $6,503
    $6,543
    $6,584
    $6,625
    $6,668
    $6,711
    $6,755
    $6,801
    $6,847
    $6,894
    $6,941
    $6,990
    $7,040
    $7,091
    $7,143
    $7,196
    $7,249
    $7,304
    Annual Debt Service
    Year 1Year 2Year 3Year 4Year 5Year 6Year 7Year 8Year 9Year 10Year 11Year 12Year 13Year 14Year 15Year 16Year 17Year 18Year 19Year 20Year 21Year 22Year 23Year 24Year 25Year 26Year 27Year 28Year 29Year 30
    Debt Service
    $11,209
    $11,209
    $11,209
    $11,209
    $11,209
    $11,209
    $11,209
    $11,209
    $11,209
    $11,209
    $11,209
    $11,209
    $11,209
    $11,209
    $11,209
    $11,209
    $11,209
    $11,209
    $11,209
    $11,209
    $11,209
    $11,209
    $11,209
    $11,209
    $11,209
    $11,209
    $11,209
    $11,209
    $11,209
    $11,209
    Mortgage Balance at Year End
    $171,433
    $168,734
    $165,898
    $162,916
    $159,782
    $156,487
    $153,024
    $149,384
    $145,558
    $141,535
    $137,307
    $132,863
    $128,191
    $123,280
    $118,118
    $112,692
    $106,988
    $100,992
    $94,690
    $88,065
    $81,102
    $73,782
    $66,087
    $57,999
    $49,497
    $40,560
    $31,166
    $21,291
    $10,911
    -
    Debt Service Coverage Ratio
    1.13%
    1.16%
    1.19%
    1.22%
    1.26%
    1.29%
    1.32%
    1.36%
    1.39%
    1.43%
    1.47%
    1.5%
    1.54%
    1.58%
    1.62%
    1.66%
    1.7%
    1.74%
    1.79%
    1.83%
    1.88%
    1.92%
    1.97%
    2.01%
    2.06%
    2.11%
    2.16%
    2.21%
    2.27%
    2.32%
    Annual Capital Improvements
    Year 1Year 2Year 3Year 4Year 5Year 6Year 7Year 8Year 9Year 10Year 11Year 12Year 13Year 14Year 15Year 16Year 17Year 18Year 19Year 20Year 21Year 22Year 23Year 24Year 25Year 26Year 27Year 28Year 29Year 30
    Capital Improvements
    $0
    $0
    $0
    $0
    $0
    $0
    $0
    $0
    $0
    $0
    $0
    $0
    $0
    $0
    $0
    $0
    $0
    $0
    $0
    $0
    $0
    $0
    $0
    $0
    $0
    $0
    $0
    $0
    $0
    $0
    Annual Cash Flow Analysis
    Year 1Year 2Year 3Year 4Year 5Year 6Year 7Year 8Year 9Year 10Year 11Year 12Year 13Year 14Year 15Year 16Year 17Year 18Year 19Year 20Year 21Year 22Year 23Year 24Year 25Year 26Year 27Year 28Year 29Year 30
    Net Operating Income
    $12,674
    $13,017
    $13,368
    $13,725
    $14,089
    $14,461
    $14,840
    $15,227
    $15,622
    $16,024
    $16,435
    $16,853
    $17,281
    $17,716
    $18,160
    $18,614
    $19,076
    $19,547
    $20,028
    $20,519
    $21,019
    $21,530
    $22,050
    $22,581
    $23,123
    $23,675
    $24,239
    $24,814
    $25,400
    $25,998
    Capitalization Rate
    5.8%
    6%
    6.1%
    6.3%
    6.5%
    6.6%
    6.8%
    7%
    7.2%
    7.4%
    7.6%
    7.7%
    7.9%
    8.1%
    8.3%
    8.6%
    8.8%
    9%
    9.2%
    9.4%
    9.7%
    9.9%
    10.1%
    10.4%
    10.6%
    10.9%
    11.1%
    11.4%
    11.7%
    12%
    Cash Flow Before Taxes
    $1,465
    $1,808
    $2,159
    $2,516
    $2,881
    $3,252
    $3,632
    $4,018
    $4,413
    $4,815
    $5,226
    $5,645
    $6,072
    $6,507
    $6,952
    $7,405
    $7,867
    $8,339
    $8,820
    $9,310
    $9,811
    $10,321
    $10,842
    $11,373
    $11,914
    $12,467
    $13,030
    $13,605
    $14,191
    $14,789
    Cash on Cash Return
    3%
    3.7%
    4.4%
    5.1%
    5.8%
    6.6%
    7.3%
    8.1%
    8.9%
    9.7%
    10.6%
    11.4%
    12.3%
    13.1%
    14%
    15%
    15.9%
    16.8%
    17.8%
    18.8%
    19.8%
    20.9%
    21.9%
    23%
    24.1%
    25.2%
    26.3%
    27.5%
    28.7%
    29.9%
    Annual Equity Accumulation
    Year 1Year 2Year 3Year 4Year 5Year 6Year 7Year 8Year 9Year 10Year 11Year 12Year 13Year 14Year 15Year 16Year 17Year 18Year 19Year 20Year 21Year 22Year 23Year 24Year 25Year 26Year 27Year 28Year 29Year 30
    Property Appreciation
    $9,000
    $9,360
    $9,734
    $10,124
    $10,529
    $10,950
    $11,388
    $11,843
    $12,317
    $12,810
    $13,322
    $13,855
    $14,409
    $14,986
    $15,585
    $16,208
    $16,857
    $17,531
    $18,232
    $18,962
    $19,720
    $20,509
    $21,329
    $22,182
    $23,070
    $23,993
    $24,952
    $25,950
    $26,988
    $28,068
    Mortgage Principal Pay Down
    $2,567
    $2,698
    $2,837
    $2,982
    $3,134
    $3,295
    $3,463
    $3,640
    $3,827
    $4,022
    $4,228
    $4,444
    $4,672
    $4,911
    $5,162
    $5,426
    $5,704
    $5,996
    $6,302
    $6,625
    $6,964
    $7,320
    $7,694
    $8,088
    $8,502
    $8,937
    $9,394
    $9,875
    $10,380
    $10,911
    Total Equity Growth
    $11,567
    $12,058
    $12,571
    $13,105
    $13,663
    $14,244
    $14,851
    $15,484
    $16,144
    $16,832
    $17,550
    $18,300
    $19,081
    $19,896
    $20,747
    $21,635
    $22,561
    $23,527
    $24,535
    $25,586
    $26,684
    $27,829
    $29,024
    $30,271
    $31,572
    $32,929
    $34,346
    $35,825
    $37,368
    $38,979
    Annual Tax Savings From Depreciation
    Year 1Year 2Year 3Year 4Year 5Year 6Year 7Year 8Year 9Year 10Year 11Year 12Year 13Year 14Year 15Year 16Year 17Year 18Year 19Year 20Year 21Year 22Year 23Year 24Year 25Year 26Year 27Year 28Year 29Year 30
    Straight Line Depreciation of Cost Basis
    $7,327
    $7,327
    $7,327
    $7,327
    $7,327
    $7,327
    $7,327
    $7,327
    $7,327
    $7,327
    $7,327
    $7,327
    $7,327
    $7,327
    $7,327
    $7,327
    $7,327
    $7,327
    $7,327
    $7,327
    $7,327
    $7,327
    $7,327
    $7,327
    $7,327
    $7,327
    $7,327
    $3,664
    $0
    $0
    Straight Line Depreciaiton of Lender Fees / Points
    $100
    $100
    $100
    $100
    $100
    $100
    $100
    $100
    $100
    $100
    $100
    $100
    $100
    $100
    $100
    $100
    $100
    $100
    $100
    $100
    $100
    $100
    $100
    $100
    $100
    $100
    $100
    $100
    $100
    $100
    Total Straight Line Depreciation
    $7,427
    $7,427
    $7,427
    $7,427
    $7,427
    $7,427
    $7,427
    $7,427
    $7,427
    $7,427
    $7,427
    $7,427
    $7,427
    $7,427
    $7,427
    $7,427
    $7,427
    $7,427
    $7,427
    $7,427
    $7,427
    $7,427
    $7,427
    $7,427
    $7,427
    $7,427
    $7,427
    $3,764
    $100
    $100
    Taxable Income Before Depreciation
    $4,032
    $4,507
    $4,995
    $5,498
    $6,015
    $6,547
    $7,095
    $7,659
    $8,240
    $8,838
    $9,454
    $10,089
    $10,743
    $11,418
    $12,114
    $12,831
    $13,571
    $14,334
    $15,122
    $15,935
    $16,774
    $17,641
    $18,536
    $19,461
    $20,416
    $21,404
    $22,424
    $23,480
    $24,571
    $25,700
    Carry Forward Loss From Depreciation
    $3,395
    $6,316
    $8,747
    $10,677
    $12,089
    $12,970
    $13,302
    $13,071
    $12,258
    $10,848
    $8,821
    $6,159
    $2,843
    $0
    $0
    $0
    $0
    $0
    $0
    $0
    $0
    $0
    $0
    $0
    $0
    $0
    $0
    $0
    $0
    $0
    Taxable Income Offset by Depreciation
    $4,032
    $4,507
    $4,995
    $5,498
    $6,015
    $6,547
    $7,095
    $7,659
    $8,240
    $8,838
    $9,454
    $10,089
    $10,743
    $10,270
    $7,427
    $7,427
    $7,427
    $7,427
    $7,427
    $7,427
    $7,427
    $7,427
    $7,427
    $7,427
    $7,427
    $7,427
    $7,427
    $3,764
    $100
    $100
    Remaining Taxable Income After Depreciation
    $0
    $0
    $0
    $0
    $0
    $0
    $0
    $0
    $0
    $0
    $0
    $0
    $0
    $1,148
    $4,686
    $5,404
    $6,144
    $6,907
    $7,695
    $8,508
    $9,347
    $10,214
    $11,109
    $12,033
    $12,989
    $13,976
    $14,997
    $19,716
    $24,471
    $25,600
    Federal Income Tax Owed on Rental Income
    $0
    $0
    $0
    $0
    $0
    $0
    $0
    $0
    $0
    $0
    $0
    $0
    $0
    $367
    $1,500
    $1,729
    $1,966
    $2,210
    $2,462
    $2,722
    $2,991
    $3,268
    $3,555
    $3,851
    $4,156
    $4,472
    $4,799
    $6,309
    $7,831
    $8,192
    Tax Savings from Depreciation
    $1,290
    $1,442
    $1,599
    $1,759
    $1,925
    $2,095
    $2,270
    $2,451
    $2,637
    $2,828
    $3,025
    $3,228
    $3,438
    $3,287
    $2,377
    $2,377
    $2,377
    $2,377
    $2,377
    $2,377
    $2,377
    $2,377
    $2,377
    $2,377
    $2,377
    $2,377
    $2,377
    $1,204
    $32
    $32
    Cash Flow After Taxes
    $1,465
    $1,808
    $2,159
    $2,516
    $2,881
    $3,252
    $3,632
    $4,018
    $4,413
    $4,815
    $5,226
    $5,645
    $6,072
    $6,140
    $5,452
    $5,676
    $5,901
    $6,128
    $6,357
    $6,588
    $6,819
    $7,053
    $7,287
    $7,522
    $7,758
    $7,994
    $8,231
    $7,296
    $6,360
    $6,597
    Performance Over Time
    Year 1Year 2Year 3Year 4Year 5Year 6Year 7Year 8Year 9Year 10Year 11Year 12Year 13Year 14Year 15Year 16Year 17Year 18Year 19Year 20Year 21Year 22Year 23Year 24Year 25Year 26Year 27Year 28Year 29Year 30
    Fair Market Property Value at Year End
    $234,000
    $243,360
    $253,094
    $263,218
    $273,747
    $284,697
    $296,085
    $307,928
    $320,245
    $333,055
    $346,377
    $360,232
    $374,642
    $389,627
    $405,212
    $421,421
    $438,278
    $455,809
    $474,041
    $493,003
    $512,723
    $533,232
    $554,561
    $576,743
    $599,813
    $623,806
    $648,758
    $674,708
    $701,697
    $729,764
    Cumulative Appreciation
    $9,000
    $18,360
    $28,094
    $38,218
    $48,747
    $59,697
    $71,085
    $82,928
    $95,245
    $108,055
    $121,377
    $135,232
    $149,642
    $164,627
    $180,212
    $196,421
    $213,278
    $230,809
    $249,041
    $268,003
    $287,723
    $308,232
    $329,561
    $351,743
    $374,813
    $398,806
    $423,758
    $449,708
    $476,697
    $504,764
    Cumulative Mortgage Principal Paydown
    $2,567
    $5,266
    $8,102
    $11,084
    $14,218
    $17,513
    $20,976
    $24,616
    $28,442
    $32,465
    $36,693
    $41,137
    $45,809
    $50,720
    $55,882
    $61,308
    $67,012
    $73,008
    $79,310
    $85,935
    $92,898
    $100,218
    $107,913
    $116,001
    $124,503
    $133,440
    $142,834
    $152,709
    $163,089
    $174,000
    Total Cumulative Equity
    $62,567
    $74,626
    $87,197
    $100,302
    $113,965
    $128,209
    $143,060
    $158,544
    $174,688
    $191,520
    $209,070
    $227,370
    $246,451
    $266,347
    $287,094
    $308,729
    $331,290
    $354,816
    $379,351
    $404,937
    $431,621
    $459,450
    $488,474
    $518,744
    $550,316
    $583,246
    $617,592
    $653,417
    $690,786
    $729,764
    Cumulative Cash Flow Before Taxes
    $1,465
    $3,273
    $5,432
    $7,948
    $10,829
    $14,081
    $17,713
    $21,732
    $26,145
    $30,960
    $36,186
    $41,831
    $47,902
    $54,410
    $61,361
    $68,766
    $76,633
    $84,972
    $93,791
    $103,101
    $112,912
    $123,233
    $134,074
    $145,447
    $157,361
    $169,828
    $182,858
    $196,463
    $210,654
    $225,443
    Cumulative Tax Savings From Depreciation
    $1,290
    $2,732
    $4,331
    $6,090
    $8,015
    $10,110
    $12,380
    $14,831
    $17,468
    $20,296
    $23,321
    $26,550
    $29,988
    $33,274
    $35,651
    $38,028
    $40,404
    $42,781
    $45,158
    $47,535
    $49,911
    $52,288
    $54,665
    $57,041
    $59,418
    $61,795
    $64,172
    $65,376
    $65,408
    $65,440
    Cumulative Cash Flow After Taxes
    $1,465
    $3,273
    $5,432
    $7,948
    $10,829
    $14,081
    $17,713
    $21,732
    $26,145
    $30,960
    $36,186
    $41,831
    $47,902
    $54,042
    $59,494
    $65,170
    $71,071
    $77,199
    $83,557
    $90,144
    $96,964
    $104,016
    $111,303
    $118,825
    $126,583
    $134,577
    $142,808
    $150,104
    $156,464
    $163,061
    Total Net Profit if Sold
    -
    $8,930
    $22,881
    $37,693
    $53,394
    $70,015
    $87,587
    $106,141
    $125,713
    $146,335
    $168,046
    $190,882
    $214,882
    $239,719
    $264,672
    $290,685
    $317,798
    $346,051
    $375,484
    $406,142
    $438,067
    $471,308
    $505,912
    $541,930
    $579,414
    $618,418
    $658,999
    $700,044
    $741,614
    $784,945
    Total Return on Investment if Sold
    -
    18.04%
    46.22%
    76.15%
    107.87%
    141.44%
    176.94%
    214.43%
    253.96%
    295.63%
    339.49%
    385.62%
    434.1%
    484.28%
    534.69%
    587.24%
    642.02%
    699.09%
    758.55%
    820.49%
    884.98%
    952.14%
    1022.04%
    1094.81%
    1170.53%
    1249.33%
    1331.31%
    1414.23%
    1498.21%
    1585.75%
    Before-Tax Return on Investment if Held
    26.3%
    28%
    29.8%
    31.6%
    33.4%
    35.3%
    37.3%
    39.4%
    41.5%
    43.7%
    46%
    48.4%
    50.8%
    53.3%
    56%
    58.7%
    61.5%
    64.4%
    67.4%
    70.5%
    73.7%
    77.1%
    80.5%
    84.1%
    87.9%
    91.7%
    95.7%
    99.9%
    104.2%
    108.6%
    After-Tax Return on Investment if Held
    26.3%
    28%
    29.8%
    31.6%
    33.4%
    35.3%
    37.3%
    39.4%
    41.5%
    43.7%
    46%
    48.4%
    50.8%
    52.6%
    52.9%
    55.2%
    57.5%
    59.9%
    62.4%
    65%
    67.7%
    70.5%
    73.4%
    76.3%
    79.5%
    82.7%
    86%
    87.1%
    88.3%
    92.1%