Own cash-flowing rentals in top U.S. markets—from anywhere.

Welcome to Alabama!

ABOUT Alabama

Alabama has the 2nd lowest property taxes in the U.S. and the Top 5 Lowest Unemployment Rates in the U.S.. It was also ranked in the Top 5 most affordable states to live in 2026 with a cost of living 12% below the national average and a cost of housing 37% below the national average.  Specific areas within Alabama are even more advantageous.  Birmingham has the 2nd lowest unemployment rate in the country among large MSAs.  It is a designated “tech hub” and has a highly diversified economy as well as a premium quality of life with beautiful weather, a vibrant downtown, and more green space per capita than any city in the U.S.  Huntsville and Decatur are smaller MSAs and have even lower unemployment rates than Birmingham!  This not only provides a stable pool of qualified tenants, but owning rental property here functions as a safe harbor during times of economic volatility, rising inflation and even a potential recession or stagflation. (Source: BLS, Rent Cafe, World Population Review).

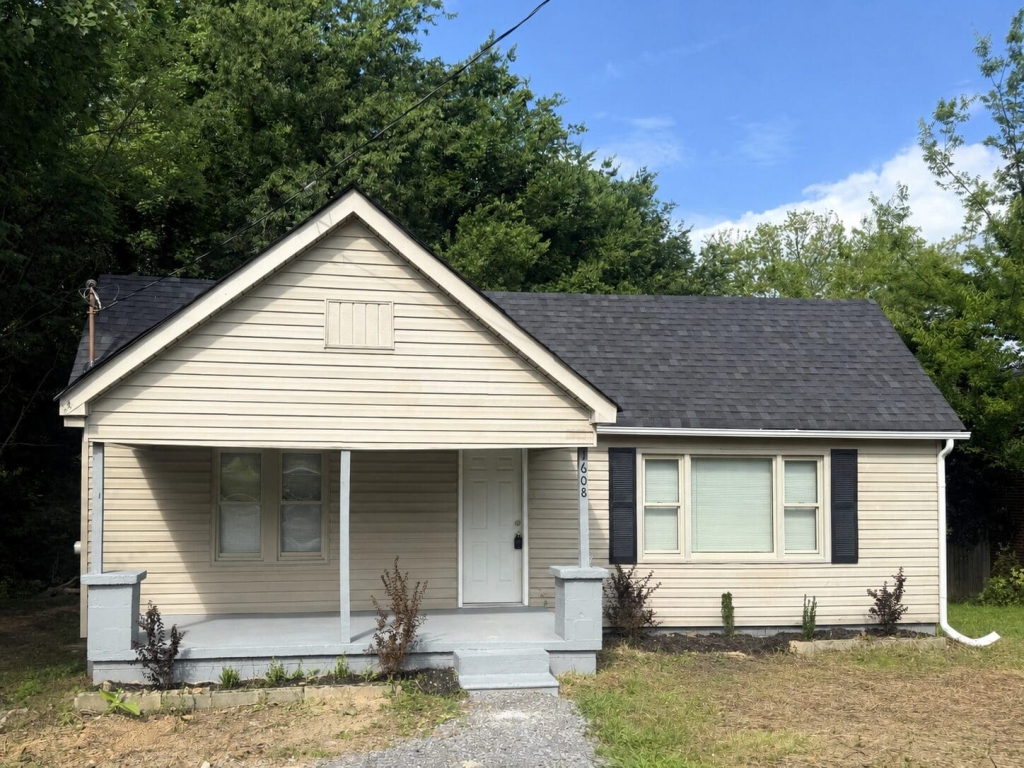
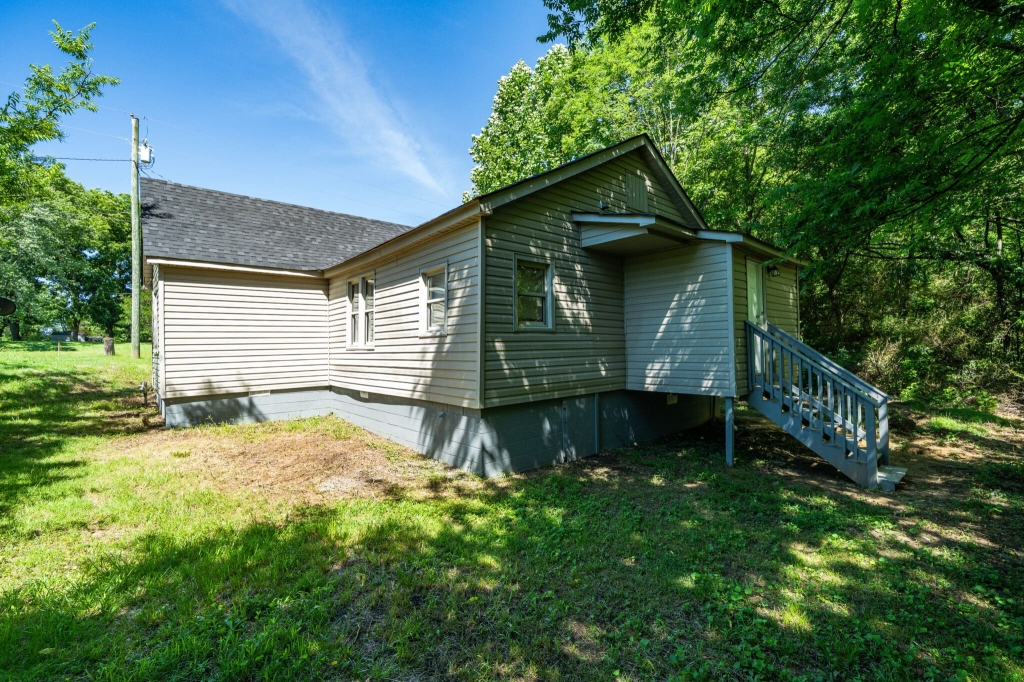
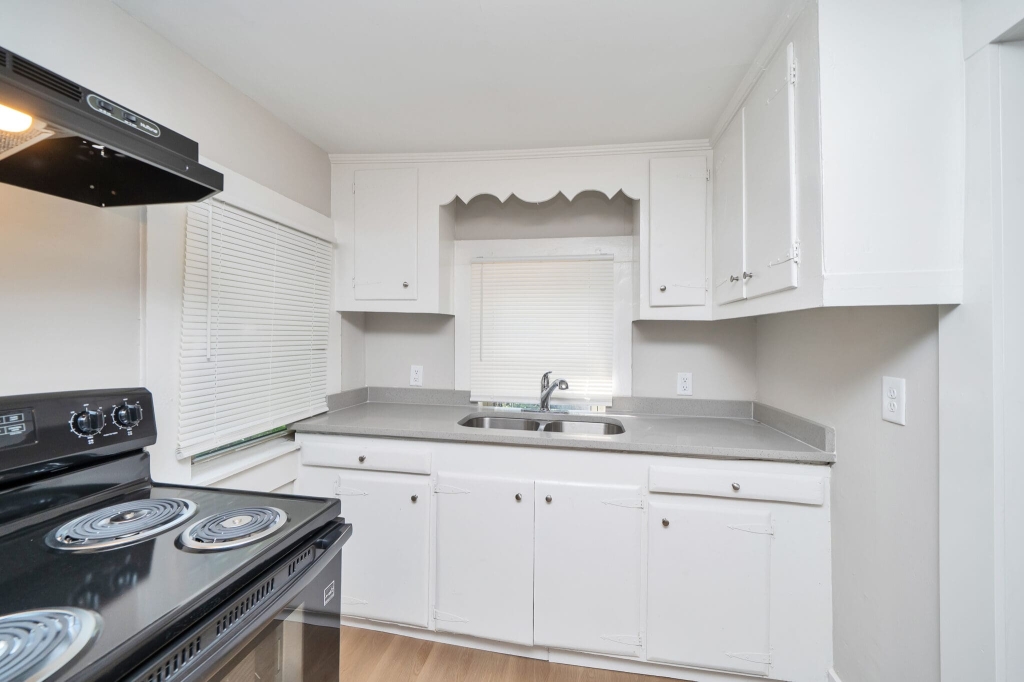
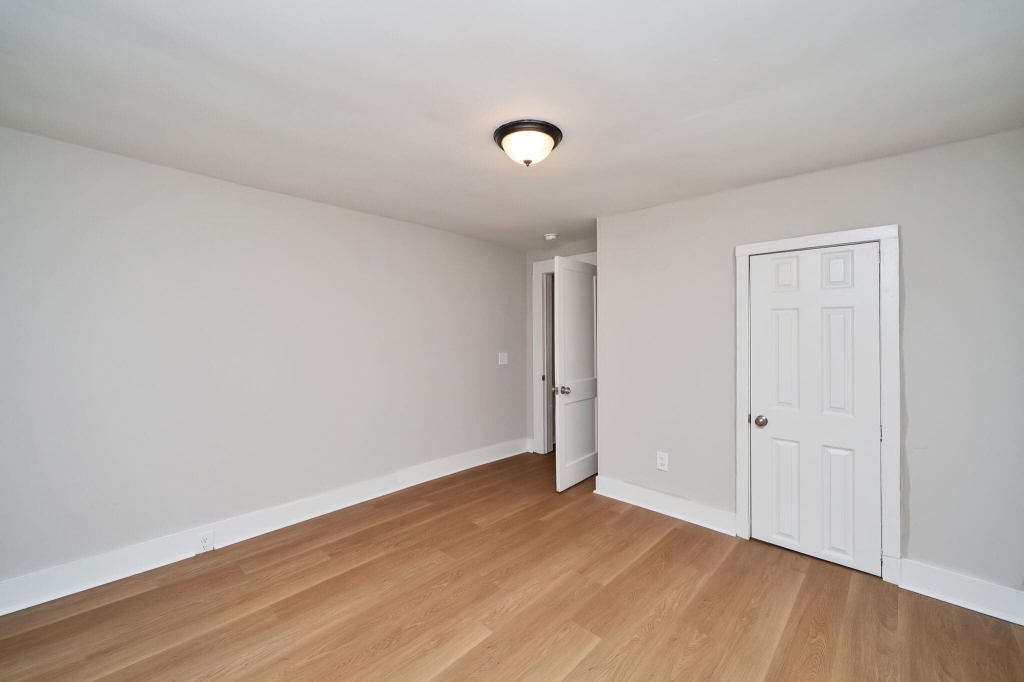
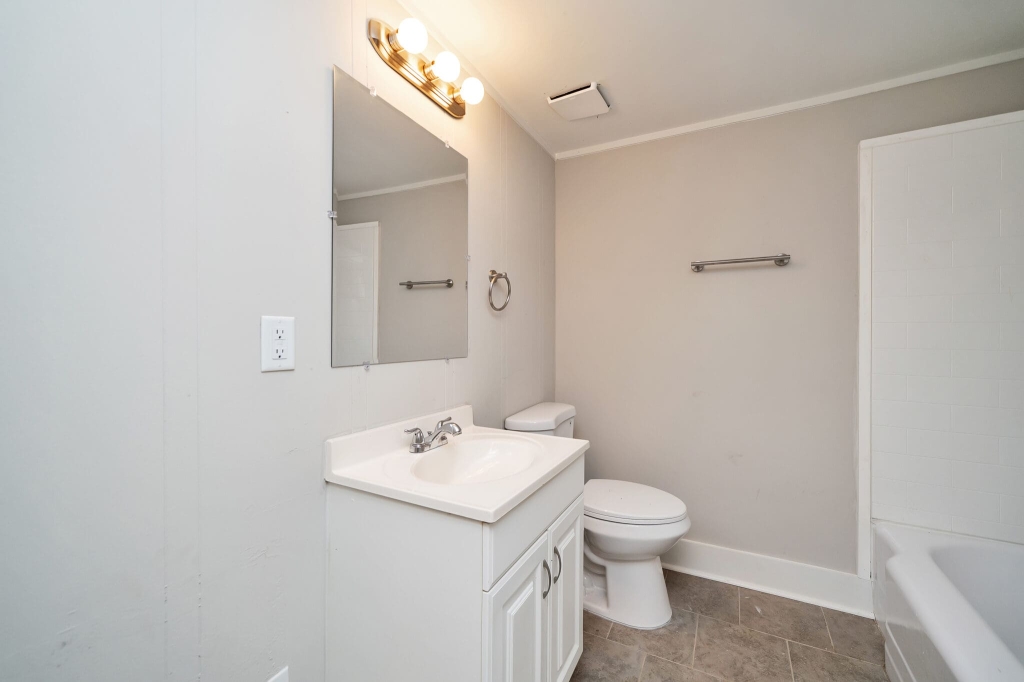
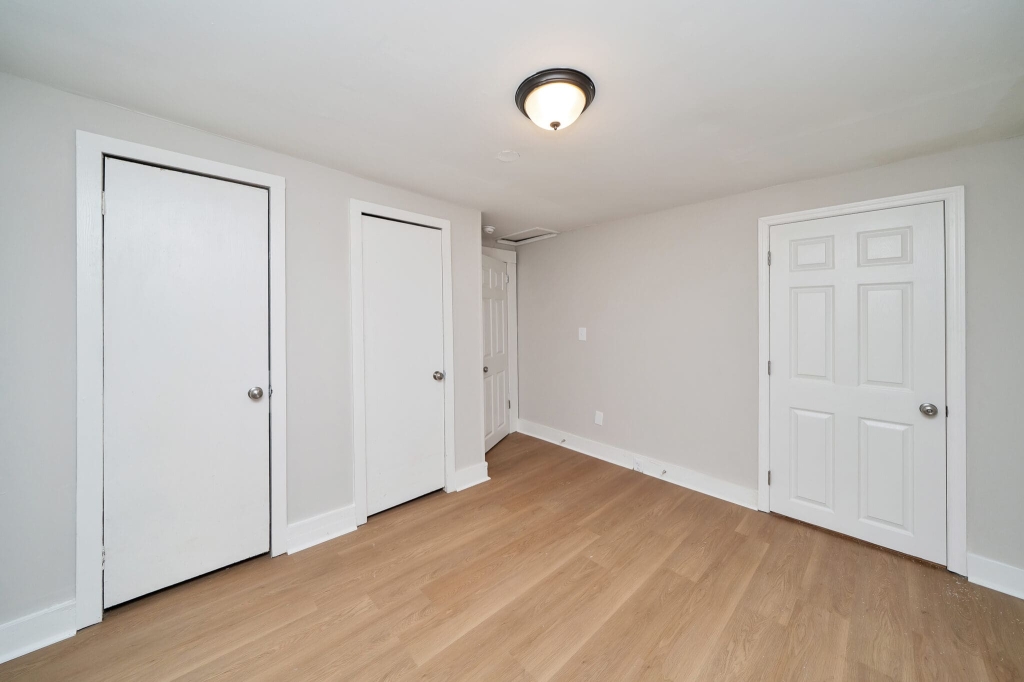
Old Huntsville Hwy Arab, AL

RESERVE THIS PROPERTY

OFFERED BY THE SELLER

  • 90 Day Scope of Work Warranty

Snapshot Financials

Price:
$ 162000
Rent:
$ 1195 / mo
Taxes:

Estimated Property Taxes

$ 33.75
Insurance:

Estimated Insurance

$ 61.1667
HOA Fee:

Home Owners Association Fee

$ 0
PM Fee:

Property Management Fee

$ 107.55
Other:
$ 0
Other:
$ 0
Vacancy:

Based on 7%

$ 83.65
Repairs:

Based on 5%

$ 59.75
Total:

Total Monthly Expenses

$ 345.867
NOI:

Monthly Net Operating Income ('NOI') = Monthly Gross Scheduled Rent - Monthly Operating Expenses - 5% Maintenance Estimate - 7% Vacancy Estimates. NOI does not take into account any financing that you may be using. The NOI is always an 'estimate' and can never be guaranteed because it includes the non-fixed variables of 'maintenance' and 'vacancy' which vary over time.

$ 849 / mo
Cap Rate:

Capitalization Rate ('Cap Rate') = Annual Net Operating Income / Purchase Price. Cap Rate does not take into account any financing you may be using nor any closing costs you may be paying.

6.3 %
GRM:

Gross Rent Multiplier ('GRM') = Purchase Price / Annual Gross Scheduled Rent. GRM is only a price to rent ratio and does not take into account any operating expenses, financing, closing cost payments or maintenance and vacancy assumptions. And remember, GRM is like a golf score, the lower the better.
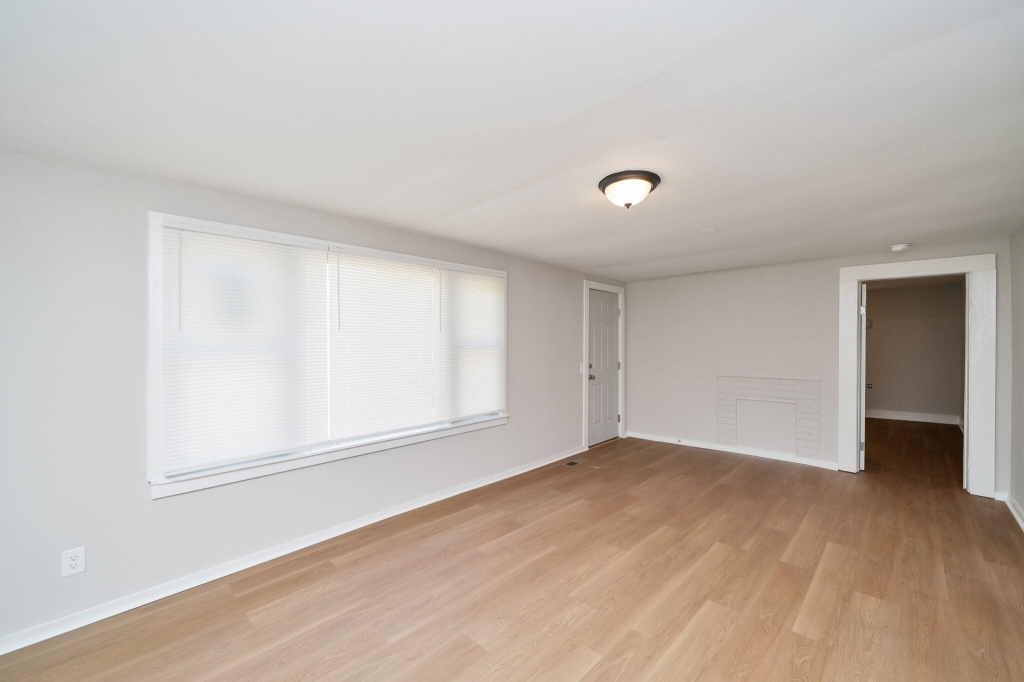
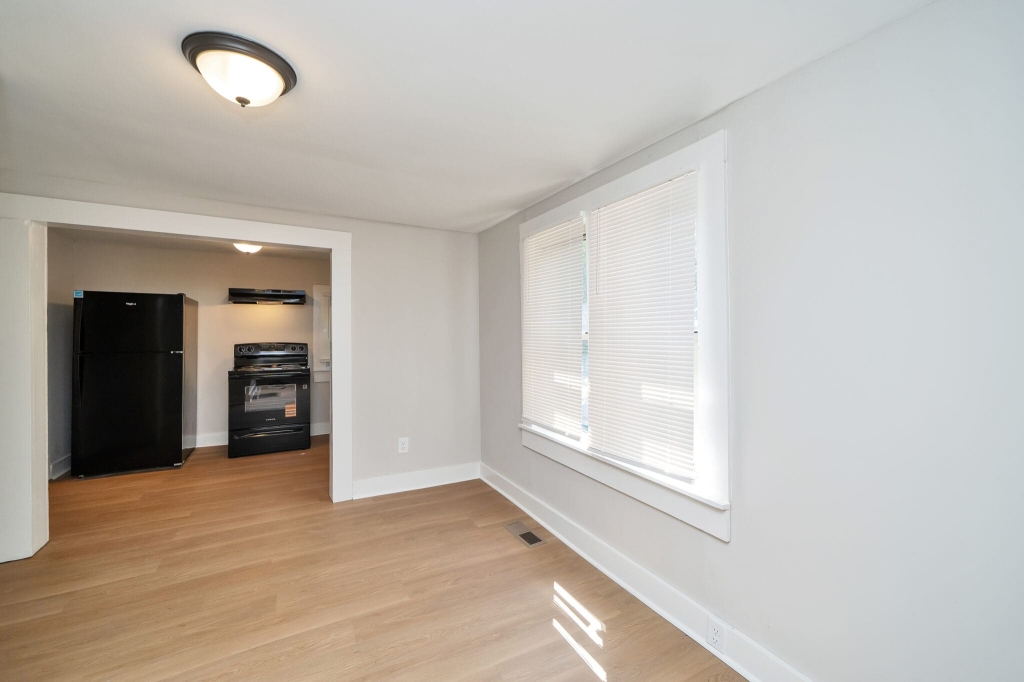
11.30

Property Features

Type:
Single Family Home
Condition:
Fully Renovated as Condition of Closing
Rental Status:
Vacant
Year Built:
1951
Bedrooms:
2
Bathrooms:
2.0
Floor Area:
980 Sq Ft
Lot Size:
n/a
Stories:
1 Story
Basement:
No Basement
Parking:
Off-Street Parking
RESERVE THIS PROPERTY
Agent Reservation

Alabama Highlights

Alabama Properties:

  • Fully-Renovated and New Construction Single Family Rental Properties
  • Local property management in place
  • $127,000 Starting Price
  • 6%+ Average Cap Rate

Alabama Market:

  • #2 Lowest Property Taxes in the U.S.
  • Top 5 Most Affordable State to Live in 2026 (World Population Review)
  • Top 5 Lowest Unemployment Rates in the U.S. (BLS.gov)
  • Cost of Living is 12% Below the National Average (Rent Cafe)
  • Cost of Housing is 37% Below the National Average (Rent Cafe)

Similar
Properties

Maverick Property Vault

Fully Renovated as Condition of Closing
$895 Net Operating Income
Fully Renovated as Condition of Closing
$650 Net Operating Income
Fully Renovated as Condition of Closing
$774 Net Operating Income
Fully Renovated as Condition of Closing
$741 Net Operating Income
Fully Renovated as Condition of Closing
$646 Net Operating Income
Fully Renovated as Condition of Closing
$762 Net Operating Income
No more properties to show

More Maverick Markets

Subscribe

    GET Access TO Private buying opportunities for TURNKEY Rental properies & EDUCATIONAL RESOURCES. READ OUR PRIVACY NOTICE & TERMS OF USE.

    Maverick's Cash-Flow Calculator

    DISCLAIMER
    OPEN

    This calculator is for recreational use only and is NOT financial or accounting software. There are a litany of variables that may be relevant to determining your individual tax obligations, financial performance and investment returns on a rental property that are NOT factored into this calculator. By using this calculator, you understand that the numbers herein are NOT specific projections of what your returns will actually be, and you agree that it is YOUR DUTY to consult with your own tax and financial professionals about the evaluation, risk assessment, realistic financial expectations, and actual tax obligations associated with any real estate investment. You also understand that ALL real estate investing involves risk, which buyer assumes 100%, and that no specific returns can ever be guaranteed by anyone.

    Top

    INSTRUCTIONS

    Click into any Investor INPUTS (THE ORANGE FIELDS) to modify.
    Click CALCULATE to update financial calculations on ALL TABS.
    Click any field LABEL to view a definition.
    Purchase
    Monthly Cashflow
    Tax Benefits
    Future Assumptions

    INSTRUCTIONS

    Click any field LABEL to view a definition.
    Cash to Purchase
    Purchase Price
    $162,000
    Fair Market Value
    $162,000
    Down Payment Amount
    $32,400
    Depreciable Closing Costs
    $3,000
    Lender Fees / Points
    $3,000
    Total Cash Invested
    $38,400
    Total Equity at Purchase
    $32,400
    Morgage Calculation
    Loan Amount
    $129,600
    Monthly Mortgage Payment
    $696
    First Year Mortgage Principal Paid Down
    $1,912
    First Year Mortgage Interest Paid
    $6,437

    INSTRUCTIONS

    Click any field LABEL to view a definition.
    First Year Monthly Cashflow
    Gross Scheduled Rent
    $1,195
    Vacancy Estimate
    $84
    Gross Operating Income
    $1,111
    Property Taxes
    $34
    Insurance
    $61
    Other Expense
    $0
    Owner-Paid Utilities / Landscaping
    $0
    Property Management Fee
    $108
    Maintenance Estimate
    $60
    Total Operating Expenses
    $262
    Net Operating Income (NOI)
    $849
    Mortgage Payment
    $696
    Cash Flow Before Taxes
    $153
    Gross Rent Multiplier (GRM)
    11.3
    Rent to Value Ratio (RV Ratio)
    0.7%
    Capitalization Rate (Cap Rate)
    6.3%
    Cash on Cash Return
    4.8%

    INSTRUCTIONS

    Click any field LABEL to view a definition.
    Tax Benefits
    Value of (Non-Depreciable) Land
    $16,200
    Value of (Depreciable) Property Structure
    $145,800
    Depreciable "Cost Basis" at Purchase
    $148,800
    Annual Straight Line Depreciation of Cost Basis
    $5,411
    Annual Depreciation of Lender Fees / Costs
    $100
    First Year Total Depreciation
    $5,511
    First Year Taxable Income Before Depreciation
    $3,752
    First Year Taxable Income Offset by Depreciation
    $3,752
    First Year Remaining Taxable Income After Depreciation
    $0
    First Year Federal Income Taxes Owed on Rental Income
    $0
    First Year Tax Savings from Depreciation on Rental Income
    $1,201
    First Year Left Over Depreciation
    $1,759

    INSTRUCTIONS

    Click any field LABEL to view a definition.
    (Swipe left or right to scroll horizontally)
    Annual Income
    Year 1Year 2Year 3Year 4Year 5Year 6Year 7Year 8Year 9Year 10Year 11Year 12Year 13Year 14Year 15Year 16Year 17Year 18Year 19Year 20Year 21Year 22Year 23Year 24Year 25Year 26Year 27Year 28Year 29Year 30
    Gross Scheduled Rent
    $14,340
    $14,627
    $14,919
    $15,218
    $15,522
    $15,833
    $16,149
    $16,472
    $16,802
    $17,138
    $17,480
    $17,830
    $18,187
    $18,550
    $18,921
    $19,300
    $19,686
    $20,079
    $20,481
    $20,891
    $21,308
    $21,735
    $22,169
    $22,613
    $23,065
    $23,526
    $23,997
    $24,477
    $24,966
    $25,466
    Vacancy Loss
    $1,004
    $1,024
    $1,044
    $1,065
    $1,087
    $1,108
    $1,130
    $1,153
    $1,176
    $1,200
    $1,224
    $1,248
    $1,273
    $1,299
    $1,324
    $1,351
    $1,378
    $1,406
    $1,434
    $1,462
    $1,492
    $1,521
    $1,552
    $1,583
    $1,615
    $1,647
    $1,680
    $1,713
    $1,748
    $1,783
    Gross Operating Income
    $13,336
    $13,603
    $13,875
    $14,152
    $14,436
    $14,724
    $15,019
    $15,319
    $15,625
    $15,938
    $16,257
    $16,582
    $16,914
    $17,252
    $17,597
    $17,949
    $18,308
    $18,674
    $19,047
    $19,428
    $19,817
    $20,213
    $20,617
    $21,030
    $21,450
    $21,879
    $22,317
    $22,763
    $23,219
    $23,683
    Annual Operating Expenses
    Year 1Year 2Year 3Year 4Year 5Year 6Year 7Year 8Year 9Year 10Year 11Year 12Year 13Year 14Year 15Year 16Year 17Year 18Year 19Year 20Year 21Year 22Year 23Year 24Year 25Year 26Year 27Year 28Year 29Year 30
    Property Taxes
    $408
    $408
    $408
    $408
    $408
    $408
    $408
    $408
    $408
    $408
    $408
    $408
    $408
    $408
    $408
    $408
    $408
    $408
    $408
    $408
    $408
    $408
    $408
    $408
    $408
    $408
    $408
    $408
    $408
    $408
    Insurance
    $732
    $732
    $732
    $732
    $732
    $732
    $732
    $732
    $732
    $732
    $732
    $732
    $732
    $732
    $732
    $732
    $732
    $732
    $732
    $732
    $732
    $732
    $732
    $732
    $732
    $732
    $732
    $732
    $732
    $732
    Maintenance Assumption
    $717
    $731
    $746
    $761
    $776
    $792
    $807
    $824
    $840
    $857
    $874
    $891
    $909
    $928
    $946
    $965
    $984
    $1,004
    $1,024
    $1,045
    $1,065
    $1,087
    $1,108
    $1,131
    $1,153
    $1,176
    $1,200
    $1,224
    $1,248
    $1,273
    Property Management
    $1,291
    $1,316
    $1,343
    $1,370
    $1,397
    $1,425
    $1,453
    $1,482
    $1,512
    $1,542
    $1,573
    $1,605
    $1,637
    $1,670
    $1,703
    $1,737
    $1,772
    $1,807
    $1,843
    $1,880
    $1,918
    $1,956
    $1,995
    $2,035
    $2,076
    $2,117
    $2,160
    $2,203
    $2,247
    $2,292
    Owner-Paid Utilities / Landscaping
    $0
    $0
    $0
    $0
    $0
    $0
    $0
    $0
    $0
    $0
    $0
    $0
    $0
    $0
    $0
    $0
    $0
    $0
    $0
    $0
    $0
    $0
    $0
    $0
    $0
    $0
    $0
    $0
    $0
    $0
    Other Expense
    $0
    $0
    $0
    $0
    $0
    $0
    $0
    $0
    $0
    $0
    $0
    $0
    $0
    $0
    $0
    $0
    $0
    $0
    $0
    $0
    $0
    $0
    $0
    $0
    $0
    $0
    $0
    $0
    $0
    $0
    Total Operating Expenses
    $3,148
    $3,188
    $3,229
    $3,270
    $3,313
    $3,357
    $3,401
    $3,446
    $3,492
    $3,539
    $3,587
    $3,636
    $3,686
    $3,737
    $3,789
    $3,842
    $3,896
    $3,951
    $4,007
    $4,065
    $4,123
    $4,183
    $4,244
    $4,306
    $4,369
    $4,434
    $4,500
    $4,567
    $4,635
    $4,705
    Annual Debt Service
    Year 1Year 2Year 3Year 4Year 5Year 6Year 7Year 8Year 9Year 10Year 11Year 12Year 13Year 14Year 15Year 16Year 17Year 18Year 19Year 20Year 21Year 22Year 23Year 24Year 25Year 26Year 27Year 28Year 29Year 30
    Debt Service
    $8,349
    $8,349
    $8,349
    $8,349
    $8,349
    $8,349
    $8,349
    $8,349
    $8,349
    $8,349
    $8,349
    $8,349
    $8,349
    $8,349
    $8,349
    $8,349
    $8,349
    $8,349
    $8,349
    $8,349
    $8,349
    $8,349
    $8,349
    $8,349
    $8,349
    $8,349
    $8,349
    $8,349
    $8,349
    $8,349
    Mortgage Balance at Year End
    $127,688
    $125,678
    $123,565
    $121,344
    $119,010
    $116,556
    $113,977
    $111,265
    $108,415
    $105,419
    $102,270
    $98,960
    $95,480
    $91,822
    $87,978
    $83,936
    $79,688
    $75,222
    $70,528
    $65,593
    $60,407
    $54,955
    $49,224
    $43,199
    $36,867
    $30,210
    $23,213
    $15,858
    $8,127
    -
    Debt Service Coverage Ratio
    1.22%
    1.25%
    1.28%
    1.3%
    1.33%
    1.36%
    1.39%
    1.42%
    1.45%
    1.49%
    1.52%
    1.55%
    1.58%
    1.62%
    1.65%
    1.69%
    1.73%
    1.76%
    1.8%
    1.84%
    1.88%
    1.92%
    1.96%
    2%
    2.05%
    2.09%
    2.13%
    2.18%
    2.23%
    2.27%
    Annual Capital Improvements
    Year 1Year 2Year 3Year 4Year 5Year 6Year 7Year 8Year 9Year 10Year 11Year 12Year 13Year 14Year 15Year 16Year 17Year 18Year 19Year 20Year 21Year 22Year 23Year 24Year 25Year 26Year 27Year 28Year 29Year 30
    Capital Improvements
    $0
    $0
    $0
    $0
    $0
    $0
    $0
    $0
    $0
    $0
    $0
    $0
    $0
    $0
    $0
    $0
    $0
    $0
    $0
    $0
    $0
    $0
    $0
    $0
    $0
    $0
    $0
    $0
    $0
    $0
    Annual Cash Flow Analysis
    Year 1Year 2Year 3Year 4Year 5Year 6Year 7Year 8Year 9Year 10Year 11Year 12Year 13Year 14Year 15Year 16Year 17Year 18Year 19Year 20Year 21Year 22Year 23Year 24Year 25Year 26Year 27Year 28Year 29Year 30
    Net Operating Income
    $10,189
    $10,415
    $10,646
    $10,882
    $11,122
    $11,368
    $11,618
    $11,873
    $12,133
    $12,399
    $12,670
    $12,946
    $13,227
    $13,515
    $13,808
    $14,107
    $14,412
    $14,723
    $15,040
    $15,364
    $15,694
    $16,030
    $16,374
    $16,724
    $17,081
    $17,446
    $17,817
    $18,197
    $18,583
    $18,978
    Capitalization Rate
    6.3%
    6.4%
    6.6%
    6.7%
    6.9%
    7%
    7.2%
    7.3%
    7.5%
    7.7%
    7.8%
    8%
    8.2%
    8.3%
    8.5%
    8.7%
    8.9%
    9.1%
    9.3%
    9.5%
    9.7%
    9.9%
    10.1%
    10.3%
    10.5%
    10.8%
    11%
    11.2%
    11.5%
    11.7%
    Cash Flow Before Taxes
    $1,840
    $2,067
    $2,298
    $2,533
    $2,774
    $3,019
    $3,269
    $3,524
    $3,785
    $4,050
    $4,321
    $4,597
    $4,879
    $5,166
    $5,459
    $5,758
    $6,063
    $6,374
    $6,691
    $7,015
    $7,345
    $7,682
    $8,025
    $8,375
    $8,733
    $9,097
    $9,469
    $9,848
    $10,235
    $10,629
    Cash on Cash Return
    4.8%
    5.4%
    6%
    6.6%
    7.2%
    7.9%
    8.5%
    9.2%
    9.9%
    10.5%
    11.3%
    12%
    12.7%
    13.5%
    14.2%
    15%
    15.8%
    16.6%
    17.4%
    18.3%
    19.1%
    20%
    20.9%
    21.8%
    22.7%
    23.7%
    24.7%
    25.6%
    26.7%
    27.7%
    Annual Equity Accumulation
    Year 1Year 2Year 3Year 4Year 5Year 6Year 7Year 8Year 9Year 10Year 11Year 12Year 13Year 14Year 15Year 16Year 17Year 18Year 19Year 20Year 21Year 22Year 23Year 24Year 25Year 26Year 27Year 28Year 29Year 30
    Property Appreciation
    $6,480
    $6,739
    $7,009
    $7,289
    $7,581
    $7,884
    $8,199
    $8,527
    $8,868
    $9,223
    $9,592
    $9,976
    $10,375
    $10,790
    $11,221
    $11,670
    $12,137
    $12,622
    $13,127
    $13,652
    $14,198
    $14,766
    $15,357
    $15,971
    $16,610
    $17,275
    $17,966
    $18,684
    $19,432
    $20,209
    Mortgage Principal Pay Down
    $1,912
    $2,010
    $2,113
    $2,221
    $2,334
    $2,454
    $2,579
    $2,711
    $2,850
    $2,996
    $3,149
    $3,310
    $3,480
    $3,658
    $3,845
    $4,042
    $4,248
    $4,466
    $4,694
    $4,934
    $5,187
    $5,452
    $5,731
    $6,024
    $6,333
    $6,656
    $6,997
    $7,355
    $7,731
    $8,127
    Total Equity Growth
    $8,392
    $8,749
    $9,121
    $9,510
    $9,915
    $10,338
    $10,779
    $11,239
    $11,718
    $12,219
    $12,741
    $13,286
    $13,854
    $14,447
    $15,066
    $15,712
    $16,385
    $17,088
    $17,821
    $18,587
    $19,385
    $20,219
    $21,088
    $21,996
    $22,943
    $23,931
    $24,963
    $26,039
    $27,163
    $28,336
    Annual Tax Savings From Depreciation
    Year 1Year 2Year 3Year 4Year 5Year 6Year 7Year 8Year 9Year 10Year 11Year 12Year 13Year 14Year 15Year 16Year 17Year 18Year 19Year 20Year 21Year 22Year 23Year 24Year 25Year 26Year 27Year 28Year 29Year 30
    Straight Line Depreciation of Cost Basis
    $5,511
    $5,511
    $5,511
    $5,511
    $5,511
    $5,511
    $5,511
    $5,511
    $5,511
    $5,511
    $5,511
    $5,511
    $5,511
    $5,511
    $5,511
    $5,511
    $5,511
    $5,511
    $5,511
    $5,511
    $5,511
    $5,511
    $5,511
    $5,511
    $5,511
    $5,511
    $5,511
    $2,755
    $0
    $0
    Straight Line Depreciaiton of Lender Fees / Points
    $100
    $100
    $100
    $100
    $100
    $100
    $100
    $100
    $100
    $100
    $100
    $100
    $100
    $100
    $100
    $100
    $100
    $100
    $100
    $100
    $100
    $100
    $100
    $100
    $100
    $100
    $100
    $100
    $100
    $100
    Total Straight Line Depreciation
    $5,611
    $5,611
    $5,611
    $5,611
    $5,611
    $5,611
    $5,611
    $5,611
    $5,611
    $5,611
    $5,611
    $5,611
    $5,611
    $5,611
    $5,611
    $5,611
    $5,611
    $5,611
    $5,611
    $5,611
    $5,611
    $5,611
    $5,611
    $5,611
    $5,611
    $5,611
    $5,611
    $2,855
    $100
    $100
    Taxable Income Before Depreciation
    $3,752
    $4,076
    $4,410
    $4,754
    $5,108
    $5,473
    $5,849
    $6,236
    $6,635
    $7,046
    $7,470
    $7,907
    $8,358
    $8,824
    $9,304
    $9,800
    $10,311
    $10,840
    $11,386
    $11,949
    $12,532
    $13,134
    $13,756
    $14,400
    $15,065
    $15,754
    $16,466
    $17,203
    $17,966
    $18,756
    Carry Forward Loss From Depreciation
    $1,859
    $3,393
    $4,594
    $5,451
    $5,953
    $6,091
    $5,854
    $5,229
    $4,205
    $2,770
    $911
    $0
    $0
    $0
    $0
    $0
    $0
    $0
    $0
    $0
    $0
    $0
    $0
    $0
    $0
    $0
    $0
    $0
    $0
    $0
    Taxable Income Offset by Depreciation
    $3,752
    $4,076
    $4,410
    $4,754
    $5,108
    $5,473
    $5,849
    $6,236
    $6,635
    $7,046
    $7,470
    $6,522
    $5,611
    $5,611
    $5,611
    $5,611
    $5,611
    $5,611
    $5,611
    $5,611
    $5,611
    $5,611
    $5,611
    $5,611
    $5,611
    $5,611
    $5,611
    $2,855
    $100
    $100
    Remaining Taxable Income After Depreciation
    $0
    $0
    $0
    $0
    $0
    $0
    $0
    $0
    $0
    $0
    $0
    $1,386
    $2,748
    $3,213
    $3,693
    $4,189
    $4,701
    $5,229
    $5,775
    $6,338
    $6,921
    $7,523
    $8,145
    $8,789
    $9,454
    $10,143
    $10,855
    $14,348
    $17,866
    $18,656
    Federal Income Tax Owed on Rental Income
    $0
    $0
    $0
    $0
    $0
    $0
    $0
    $0
    $0
    $0
    $0
    $443
    $879
    $1,028
    $1,182
    $1,340
    $1,504
    $1,673
    $1,848
    $2,028
    $2,215
    $2,407
    $2,606
    $2,812
    $3,025
    $3,246
    $3,474
    $4,591
    $5,717
    $5,970
    Tax Savings from Depreciation
    $1,201
    $1,304
    $1,411
    $1,521
    $1,635
    $1,751
    $1,872
    $1,995
    $2,123
    $2,255
    $2,390
    $2,087
    $1,795
    $1,795
    $1,795
    $1,795
    $1,795
    $1,795
    $1,795
    $1,795
    $1,795
    $1,795
    $1,795
    $1,795
    $1,795
    $1,795
    $1,795
    $914
    $32
    $32
    Cash Flow After Taxes
    $1,840
    $2,067
    $2,298
    $2,533
    $2,774
    $3,019
    $3,269
    $3,524
    $3,785
    $4,050
    $4,321
    $4,154
    $4,000
    $4,138
    $4,277
    $4,418
    $4,559
    $4,701
    $4,843
    $4,987
    $5,130
    $5,274
    $5,419
    $5,563
    $5,707
    $5,851
    $5,995
    $5,257
    $4,518
    $4,659
    Performance Over Time
    Year 1Year 2Year 3Year 4Year 5Year 6Year 7Year 8Year 9Year 10Year 11Year 12Year 13Year 14Year 15Year 16Year 17Year 18Year 19Year 20Year 21Year 22Year 23Year 24Year 25Year 26Year 27Year 28Year 29Year 30
    Fair Market Property Value at Year End
    $168,480
    $175,219
    $182,228
    $189,517
    $197,098
    $204,982
    $213,181
    $221,708
    $230,577
    $239,800
    $249,392
    $259,367
    $269,742
    $280,532
    $291,753
    $303,423
    $315,560
    $328,182
    $341,310
    $354,962
    $369,160
    $383,927
    $399,284
    $415,255
    $431,865
    $449,140
    $467,106
    $485,790
    $505,222
    $525,430
    Cumulative Appreciation
    $6,480
    $13,219
    $20,228
    $27,517
    $35,098
    $42,982
    $51,181
    $59,708
    $68,577
    $77,800
    $87,392
    $97,367
    $107,742
    $118,532
    $129,753
    $141,423
    $153,560
    $166,182
    $179,310
    $192,962
    $207,160
    $221,927
    $237,284
    $253,255
    $269,865
    $287,140
    $305,106
    $323,790
    $343,222
    $363,430
    Cumulative Mortgage Principal Paydown
    $1,912
    $3,922
    $6,035
    $8,256
    $10,590
    $13,044
    $15,623
    $18,335
    $21,185
    $24,181
    $27,330
    $30,640
    $34,120
    $37,778
    $41,622
    $45,664
    $49,912
    $54,378
    $59,072
    $64,007
    $69,193
    $74,645
    $80,376
    $86,401
    $92,733
    $99,390
    $106,387
    $113,742
    $121,473
    $129,600
    Total Cumulative Equity
    $40,792
    $49,541
    $58,663
    $68,173
    $78,088
    $88,426
    $99,204
    $110,443
    $122,161
    $134,380
    $147,121
    $160,407
    $174,262
    $188,709
    $203,775
    $219,487
    $235,872
    $252,960
    $270,782
    $289,368
    $308,754
    $328,972
    $350,060
    $372,056
    $394,999
    $418,930
    $443,892
    $469,932
    $497,095
    $525,430
    Cumulative Cash Flow Before Taxes
    $1,840
    $3,906
    $6,204
    $8,737
    $11,511
    $14,530
    $17,799
    $21,324
    $25,108
    $29,159
    $33,479
    $38,076
    $42,955
    $48,121
    $53,580
    $59,339
    $65,402
    $71,776
    $78,467
    $85,482
    $92,827
    $100,509
    $108,534
    $116,910
    $125,642
    $134,739
    $144,208
    $154,056
    $164,291
    $174,920
    Cumulative Tax Savings From Depreciation
    $1,201
    $2,505
    $3,916
    $5,438
    $7,072
    $8,824
    $10,695
    $12,691
    $14,814
    $17,069
    $19,459
    $21,546
    $23,341
    $25,137
    $26,932
    $28,728
    $30,523
    $32,319
    $34,114
    $35,910
    $37,705
    $39,501
    $41,296
    $43,092
    $44,887
    $46,683
    $48,478
    $49,392
    $49,424
    $49,456
    Cumulative Cash Flow After Taxes
    $1,840
    $3,906
    $6,204
    $8,737
    $11,511
    $14,530
    $17,799
    $21,324
    $25,108
    $29,159
    $33,479
    $37,633
    $41,633
    $45,770
    $50,048
    $54,466
    $59,025
    $63,725
    $68,569
    $73,556
    $78,686
    $83,960
    $89,379
    $94,942
    $100,649
    $106,501
    $112,496
    $117,753
    $122,270
    $126,930
    Total Net Profit if Sold
    -
    $1,030
    $11,889
    $23,349
    $35,431
    $48,157
    $61,549
    $75,630
    $90,424
    $105,955
    $122,249
    $138,891
    $155,915
    $173,637
    $192,083
    $211,279
    $231,252
    $252,031
    $273,646
    $296,127
    $319,507
    $343,818
    $369,097
    $395,378
    $422,699
    $451,099
    $480,620
    $510,421
    $540,547
    $571,926
    Total Return on Investment if Sold
    -
    2.68%
    30.96%
    60.8%
    92.27%
    125.41%
    160.28%
    196.95%
    235.48%
    275.92%
    318.36%
    361.7%
    406.03%
    452.18%
    500.22%
    550.21%
    602.22%
    656.33%
    712.62%
    771.16%
    832.05%
    895.36%
    961.19%
    1029.63%
    1100.78%
    1174.74%
    1251.61%
    1329.22%
    1407.68%
    1489.39%
    Before-Tax Return on Investment if Held
    26.6%
    28.2%
    29.7%
    31.4%
    33%
    34.8%
    36.6%
    38.4%
    40.4%
    42.4%
    44.4%
    46.6%
    48.8%
    51.1%
    53.5%
    55.9%
    58.5%
    61.1%
    63.8%
    66.7%
    69.6%
    72.7%
    75.8%
    79.1%
    82.5%
    86%
    89.7%
    93.5%
    97.4%
    101.5%
    After-Tax Return on Investment if Held
    26.6%
    28.2%
    29.7%
    31.4%
    33%
    34.8%
    36.6%
    38.4%
    40.4%
    42.4%
    44.4%
    45.4%
    46.5%
    48.4%
    50.4%
    52.4%
    54.5%
    56.7%
    59%
    61.4%
    63.8%
    66.4%
    69%
    71.8%
    74.6%
    77.6%
    80.6%
    81.5%
    82.5%
    85.9%