Own Cash-Flowing Rental Properties in the Best U.S. Markets From Anywhere!

Welcome to Indianapolis!

ABOUT Indianapolis

Coming off a 2025 year when the Indiana Pacers made it to the NBA Finals and the Indiana Fever made it to the WNBA semi-finals (and won the Commissioners Cup), Indianapolis is one of the most exciting cities in the country right now! And Indy is uniquely advantageous for real estate investors too, with optimal price-to-rent ratios and strong market fundamentals. The residential population has grown over 20% in the last 15 years, the cost of living is well below the national average, and the unemployment rate is one of the lowest in the country. The city is abuzz, people are moving in, and there is a large pool of qualified tenants looking to rent properties.

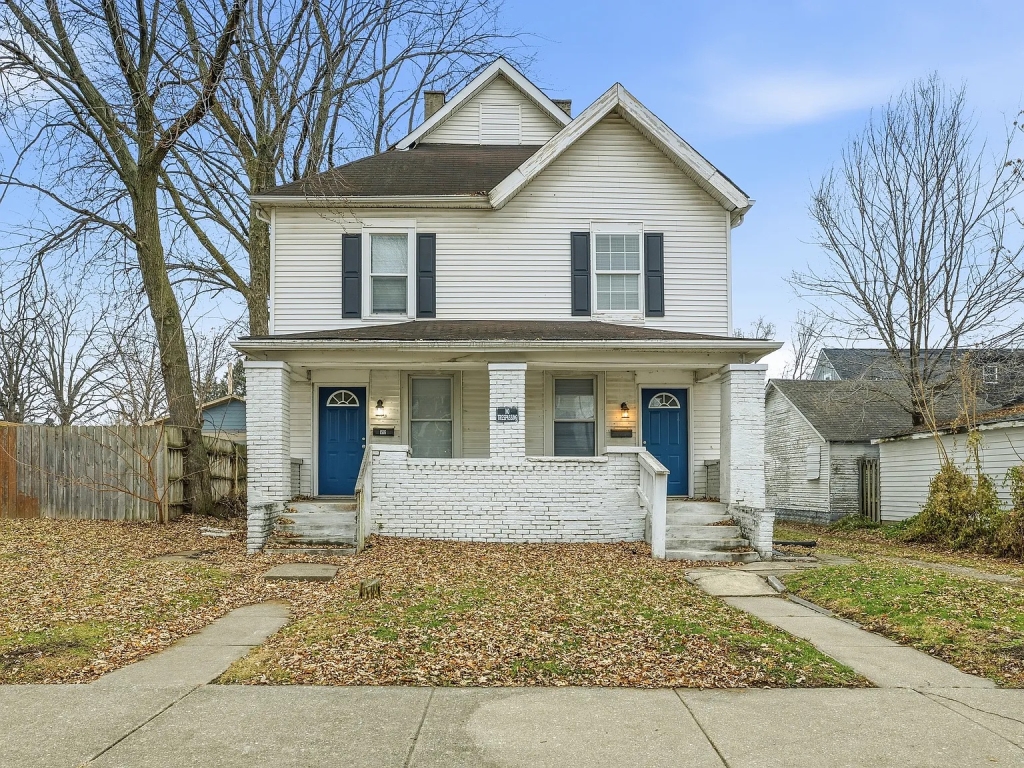
Ringgold Avenue Indianapolis, IN

RESERVE THIS PROPERTY

OFFERED BY THE SELLER

  • 60 Day Rent Guarantee
  • 90 Day Scope-of-Work Warranty

Snapshot Financials

Price:
$ 299900
Rent:
$ 2590 / mo
Taxes:

Estimated Property Taxes

$ 353.667
Insurance:

Estimated Insurance

$ 125
HOA Fee:

Home Owners Association Fee

$ 0
PM Fee:

Property Management Fee

$ 207.2
Other:
$ 0
Other:
$ 0
Vacancy:

Based on 7%

$ 181.3
Repairs:

Based on 5%

$ 129.5
Total:

Total Monthly Expenses

$ 996.667
NOI:

Monthly Net Operating Income ('NOI') = Monthly Gross Scheduled Rent - Monthly Operating Expenses - 5% Maintenance Estimate - 7% Vacancy Estimates. NOI does not take into account any financing that you may be using. The NOI is always an 'estimate' and can never be guaranteed because it includes the non-fixed variables of 'maintenance' and 'vacancy' which vary over time.

$ 1,593 / mo
Cap Rate:

Capitalization Rate ('Cap Rate') = Annual Net Operating Income / Purchase Price. Cap Rate does not take into account any financing you may be using nor any closing costs you may be paying.

6.4 %
GRM:

Gross Rent Multiplier ('GRM') = Purchase Price / Annual Gross Scheduled Rent. GRM is only a price to rent ratio and does not take into account any operating expenses, financing, closing cost payments or maintenance and vacancy assumptions. And remember, GRM is like a golf score, the lower the better.

9.65

Property Features

Type:
Duplex
Condition:
Fully Renovated as Condition of Closing
Rental Status:
Vacant
Year Built:
1900
Bedrooms:
6
Bathrooms:
2.0
Floor Area:
2600 Sq Ft
Lot Size:
n/a
Stories:
2 Stories
Basement:
Unfinished
Parking:
Off-Street Parking
RESERVE THIS PROPERTY
Agent Reservation

Seller's Additional Notes

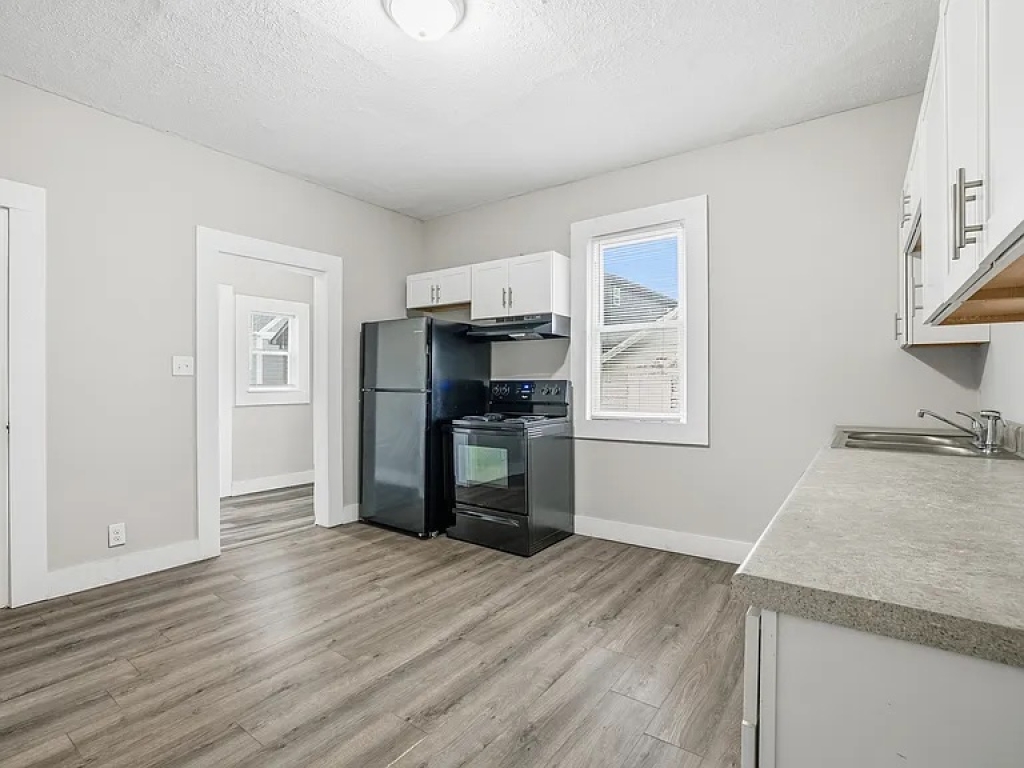
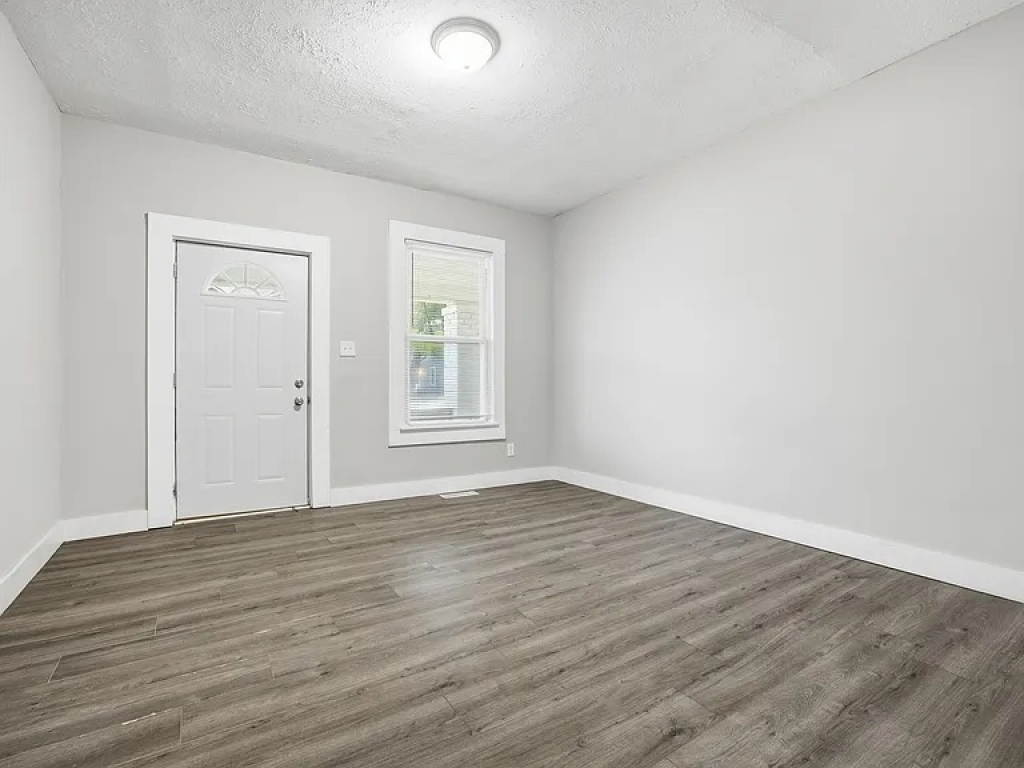
Located just outside of downtown and minutes from Fountain Square, Bates Hendricks and Garfield Park, this fully renovated 3-bedroom, 1-bath (per side) duplex is truly move-in ready. Each unit has been thoughtfully updated and features fresh, neutral paint throughout, carpeting, luxury vinyl plank flooring, and modern finishes. The spacious kitchen offers abundant cabinetry, newer countertops, and comes fully equipped with appliances. The bright, refreshed bathroom showcases a new vanity, sink, and shower surround. A basement with updated mechanicals provides valuable additional storage. Upstairs, three generously sized bedrooms offer a cozy feel with plush carpeting. Adding even more appeal, the city recently installed a brand-new park directly across the street-perfect for residents or tenants to enjoy. This turnkey duplex presents an excellent investment opportunity in a highly desirable location.

Indianapolis Highlights

Indianapolis Properties:

  • Fully-Renovated Single Family and Duplexes
  • Tenants and Local Property Management in Place
  • 7% Average Cap Rate
  • 155K Starting Price
  • Hand-Selected Neighborhoods

Indianapolis Market:

  • One of the hottest sports towns in the country with the Indiana Fever and Pacers selling out games
  • Cost of Living and Unemployment are both below the national average (Source: BLS.gov).
  • Job growth – Thousands of new jobs being created, producing a large pool of qualified tenants
  • College town – universities create consistent rental demand.

Similar
Properties

Maverick Property Vault

$1,354 Net Operating Income
$813 Net Operating Income
$967 Net Operating Income
$1,104 Net Operating Income

More Maverick Markets

Subscribe

    GET Access TO Private buying opportunities for TURNKEY Rental properies & EDUCATIONAL RESOURCES. READ OUR PRIVACY NOTICE & TERMS OF USE.

    Maverick's Cash-Flow Calculator

    DISCLAIMER
    OPEN

    This calculator is for recreational use only and is NOT financial or accounting software. There are a litany of variables that may be relevant to determining your individual tax obligations, financial performance and investment returns on a rental property that are NOT factored into this calculator. By using this calculator, you understand that the numbers herein are NOT specific projections of what your returns will actually be, and you agree that it is YOUR DUTY to consult with your own tax and financial professionals about the evaluation, risk assessment, realistic financial expectations, and actual tax obligations associated with any real estate investment. You also understand that ALL real estate investing involves risk, which buyer assumes 100%, and that no specific returns can ever be guaranteed by anyone.

    Top

    INSTRUCTIONS

    Click into any Investor INPUTS (THE ORANGE FIELDS) to modify.
    Click CALCULATE to update financial calculations on ALL TABS.
    Click any field LABEL to view a definition.
    Purchase
    Monthly Cashflow
    Tax Benefits
    Future Assumptions

    INSTRUCTIONS

    Click any field LABEL to view a definition.
    Cash to Purchase
    Purchase Price
    $299,900
    Fair Market Value
    $299,900
    Down Payment Amount
    $59,980
    Depreciable Closing Costs
    $3,000
    Lender Fees / Points
    $3,000
    Total Cash Invested
    $65,980
    Total Equity at Purchase
    $59,980
    Morgage Calculation
    Loan Amount
    $239,920
    Monthly Mortgage Payment
    $1,288
    First Year Mortgage Principal Paid Down
    $3,540
    First Year Mortgage Interest Paid
    $11,916

    INSTRUCTIONS

    Click any field LABEL to view a definition.
    First Year Monthly Cashflow
    Gross Scheduled Rent
    $2,590
    Vacancy Estimate
    $181
    Gross Operating Income
    $2,409
    Property Taxes
    $354
    Insurance
    $125
    Other Expense
    $0
    Owner-Paid Utilities / Landscaping
    $0
    Property Management Fee
    $207
    Maintenance Estimate
    $130
    Total Operating Expenses
    $816
    Net Operating Income (NOI)
    $1,593
    Mortgage Payment
    $1,288
    Cash Flow Before Taxes
    $305
    Gross Rent Multiplier (GRM)
    9.6
    Rent to Value Ratio (RV Ratio)
    0.9%
    Capitalization Rate (Cap Rate)
    6.4%
    Cash on Cash Return
    5.5%

    INSTRUCTIONS

    Click any field LABEL to view a definition.
    Tax Benefits
    Value of (Non-Depreciable) Land
    $29,990
    Value of (Depreciable) Property Structure
    $269,910
    Depreciable "Cost Basis" at Purchase
    $272,910
    Annual Straight Line Depreciation of Cost Basis
    $9,924
    Annual Depreciation of Lender Fees / Costs
    $100
    First Year Total Depreciation
    $10,024
    First Year Taxable Income Before Depreciation
    $7,200
    First Year Taxable Income Offset by Depreciation
    $7,200
    First Year Remaining Taxable Income After Depreciation
    $0
    First Year Federal Income Taxes Owed on Rental Income
    $0
    First Year Tax Savings from Depreciation on Rental Income
    $2,304
    First Year Left Over Depreciation
    $2,824

    INSTRUCTIONS

    Click any field LABEL to view a definition.
    (Swipe left or right to scroll horizontally)
    Annual Income
    Year 1Year 2Year 3Year 4Year 5Year 6Year 7Year 8Year 9Year 10Year 11Year 12Year 13Year 14Year 15Year 16Year 17Year 18Year 19Year 20Year 21Year 22Year 23Year 24Year 25Year 26Year 27Year 28Year 29Year 30
    Gross Scheduled Rent
    $31,080
    $31,702
    $32,336
    $32,982
    $33,642
    $34,315
    $35,001
    $35,701
    $36,415
    $37,143
    $37,886
    $38,644
    $39,417
    $40,205
    $41,009
    $41,830
    $42,666
    $43,520
    $44,390
    $45,278
    $46,183
    $47,107
    $48,049
    $49,010
    $49,990
    $50,990
    $52,010
    $53,050
    $54,111
    $55,193
    Vacancy Loss
    $2,176
    $2,219
    $2,263
    $2,309
    $2,355
    $2,402
    $2,450
    $2,499
    $2,549
    $2,600
    $2,652
    $2,705
    $2,759
    $2,814
    $2,871
    $2,928
    $2,987
    $3,046
    $3,107
    $3,169
    $3,233
    $3,297
    $3,363
    $3,431
    $3,499
    $3,569
    $3,641
    $3,714
    $3,788
    $3,864
    Gross Operating Income
    $28,904
    $29,482
    $30,072
    $30,674
    $31,287
    $31,913
    $32,551
    $33,202
    $33,866
    $34,543
    $35,234
    $35,939
    $36,658
    $37,391
    $38,139
    $38,902
    $39,680
    $40,473
    $41,283
    $42,108
    $42,950
    $43,809
    $44,686
    $45,579
    $46,491
    $47,421
    $48,369
    $49,337
    $50,323
    $51,330
    Annual Operating Expenses
    Year 1Year 2Year 3Year 4Year 5Year 6Year 7Year 8Year 9Year 10Year 11Year 12Year 13Year 14Year 15Year 16Year 17Year 18Year 19Year 20Year 21Year 22Year 23Year 24Year 25Year 26Year 27Year 28Year 29Year 30
    Property Taxes
    $4,248
    $4,248
    $4,248
    $4,248
    $4,248
    $4,248
    $4,248
    $4,248
    $4,248
    $4,248
    $4,248
    $4,248
    $4,248
    $4,248
    $4,248
    $4,248
    $4,248
    $4,248
    $4,248
    $4,248
    $4,248
    $4,248
    $4,248
    $4,248
    $4,248
    $4,248
    $4,248
    $4,248
    $4,248
    $4,248
    Insurance
    $1,500
    $1,500
    $1,500
    $1,500
    $1,500
    $1,500
    $1,500
    $1,500
    $1,500
    $1,500
    $1,500
    $1,500
    $1,500
    $1,500
    $1,500
    $1,500
    $1,500
    $1,500
    $1,500
    $1,500
    $1,500
    $1,500
    $1,500
    $1,500
    $1,500
    $1,500
    $1,500
    $1,500
    $1,500
    $1,500
    Maintenance Assumption
    $1,554
    $1,585
    $1,617
    $1,649
    $1,682
    $1,716
    $1,750
    $1,785
    $1,821
    $1,857
    $1,894
    $1,932
    $1,971
    $2,010
    $2,050
    $2,091
    $2,133
    $2,176
    $2,219
    $2,264
    $2,309
    $2,355
    $2,402
    $2,451
    $2,500
    $2,550
    $2,600
    $2,653
    $2,706
    $2,760
    Property Management
    $2,486
    $2,536
    $2,587
    $2,639
    $2,691
    $2,745
    $2,800
    $2,856
    $2,913
    $2,971
    $3,031
    $3,092
    $3,153
    $3,216
    $3,281
    $3,346
    $3,413
    $3,482
    $3,551
    $3,622
    $3,695
    $3,769
    $3,844
    $3,921
    $3,999
    $4,079
    $4,161
    $4,244
    $4,329
    $4,415
    Owner-Paid Utilities / Landscaping
    $0
    $0
    $0
    $0
    $0
    $0
    $0
    $0
    $0
    $0
    $0
    $0
    $0
    $0
    $0
    $0
    $0
    $0
    $0
    $0
    $0
    $0
    $0
    $0
    $0
    $0
    $0
    $0
    $0
    $0
    Other Expense
    $0
    $0
    $0
    $0
    $0
    $0
    $0
    $0
    $0
    $0
    $0
    $0
    $0
    $0
    $0
    $0
    $0
    $0
    $0
    $0
    $0
    $0
    $0
    $0
    $0
    $0
    $0
    $0
    $0
    $0
    Total Operating Expenses
    $9,788
    $9,869
    $9,952
    $10,036
    $10,121
    $10,209
    $10,298
    $10,389
    $10,482
    $10,577
    $10,673
    $10,772
    $10,872
    $10,975
    $11,079
    $11,186
    $11,295
    $11,406
    $11,519
    $11,634
    $11,752
    $11,872
    $11,994
    $12,119
    $12,247
    $12,377
    $12,509
    $12,645
    $12,782
    $12,923
    Annual Debt Service
    Year 1Year 2Year 3Year 4Year 5Year 6Year 7Year 8Year 9Year 10Year 11Year 12Year 13Year 14Year 15Year 16Year 17Year 18Year 19Year 20Year 21Year 22Year 23Year 24Year 25Year 26Year 27Year 28Year 29Year 30
    Debt Service
    $15,455
    $15,455
    $15,455
    $15,455
    $15,455
    $15,455
    $15,455
    $15,455
    $15,455
    $15,455
    $15,455
    $15,455
    $15,455
    $15,455
    $15,455
    $15,455
    $15,455
    $15,455
    $15,455
    $15,455
    $15,455
    $15,455
    $15,455
    $15,455
    $15,455
    $15,455
    $15,455
    $15,455
    $15,455
    $15,455
    Mortgage Balance at Year End
    $236,380
    $232,660
    $228,748
    $224,637
    $220,315
    $215,773
    $210,998
    $205,978
    $200,702
    $195,156
    $189,326
    $183,198
    $176,756
    $169,985
    $162,867
    $155,385
    $147,521
    $139,254
    $130,564
    $121,429
    $111,827
    $101,734
    $91,124
    $79,972
    $68,249
    $55,926
    $42,973
    $29,357
    $15,045
    -
    Debt Service Coverage Ratio
    1.24%
    1.27%
    1.3%
    1.34%
    1.37%
    1.4%
    1.44%
    1.48%
    1.51%
    1.55%
    1.59%
    1.63%
    1.67%
    1.71%
    1.75%
    1.79%
    1.84%
    1.88%
    1.93%
    1.97%
    2.02%
    2.07%
    2.12%
    2.16%
    2.22%
    2.27%
    2.32%
    2.37%
    2.43%
    2.49%
    Annual Capital Improvements
    Year 1Year 2Year 3Year 4Year 5Year 6Year 7Year 8Year 9Year 10Year 11Year 12Year 13Year 14Year 15Year 16Year 17Year 18Year 19Year 20Year 21Year 22Year 23Year 24Year 25Year 26Year 27Year 28Year 29Year 30
    Capital Improvements
    $0
    $0
    $0
    $0
    $0
    $0
    $0
    $0
    $0
    $0
    $0
    $0
    $0
    $0
    $0
    $0
    $0
    $0
    $0
    $0
    $0
    $0
    $0
    $0
    $0
    $0
    $0
    $0
    $0
    $0
    Annual Cash Flow Analysis
    Year 1Year 2Year 3Year 4Year 5Year 6Year 7Year 8Year 9Year 10Year 11Year 12Year 13Year 14Year 15Year 16Year 17Year 18Year 19Year 20Year 21Year 22Year 23Year 24Year 25Year 26Year 27Year 28Year 29Year 30
    Net Operating Income
    $19,116
    $19,613
    $20,121
    $20,638
    $21,166
    $21,704
    $22,253
    $22,813
    $23,384
    $23,967
    $24,561
    $25,167
    $25,786
    $26,416
    $27,060
    $27,716
    $28,385
    $29,068
    $29,764
    $30,474
    $31,199
    $31,938
    $32,691
    $33,460
    $34,244
    $35,044
    $35,860
    $36,692
    $37,541
    $38,407
    Capitalization Rate
    6.4%
    6.5%
    6.7%
    6.9%
    7.1%
    7.2%
    7.4%
    7.6%
    7.8%
    8%
    8.2%
    8.4%
    8.6%
    8.8%
    9%
    9.2%
    9.5%
    9.7%
    9.9%
    10.2%
    10.4%
    10.6%
    10.9%
    11.2%
    11.4%
    11.7%
    12%
    12.2%
    12.5%
    12.8%
    Cash Flow Before Taxes
    $3,661
    $4,158
    $4,665
    $5,183
    $5,710
    $6,249
    $6,798
    $7,358
    $7,929
    $8,511
    $9,106
    $9,712
    $10,330
    $10,961
    $11,604
    $12,260
    $12,930
    $13,612
    $14,309
    $15,019
    $15,743
    $16,482
    $17,236
    $18,005
    $18,789
    $19,589
    $20,405
    $21,237
    $22,086
    $22,951
    Cash on Cash Return
    5.5%
    6.3%
    7.1%
    7.9%
    8.7%
    9.5%
    10.3%
    11.2%
    12%
    12.9%
    13.8%
    14.7%
    15.7%
    16.6%
    17.6%
    18.6%
    19.6%
    20.6%
    21.7%
    22.8%
    23.9%
    25%
    26.1%
    27.3%
    28.5%
    29.7%
    30.9%
    32.2%
    33.5%
    34.8%
    Annual Equity Accumulation
    Year 1Year 2Year 3Year 4Year 5Year 6Year 7Year 8Year 9Year 10Year 11Year 12Year 13Year 14Year 15Year 16Year 17Year 18Year 19Year 20Year 21Year 22Year 23Year 24Year 25Year 26Year 27Year 28Year 29Year 30
    Property Appreciation
    $11,996
    $12,476
    $12,975
    $13,494
    $14,034
    $14,595
    $15,179
    $15,786
    $16,417
    $17,074
    $17,757
    $18,467
    $19,206
    $19,974
    $20,773
    $21,604
    $22,468
    $23,367
    $24,302
    $25,274
    $26,285
    $27,336
    $28,430
    $29,567
    $30,749
    $31,979
    $33,259
    $34,589
    $35,972
    $37,411
    Mortgage Principal Pay Down
    $3,540
    $3,721
    $3,911
    $4,111
    $4,322
    $4,543
    $4,775
    $5,019
    $5,276
    $5,546
    $5,830
    $6,128
    $6,442
    $6,771
    $7,118
    $7,482
    $7,865
    $8,267
    $8,690
    $9,135
    $9,602
    $10,093
    $10,610
    $11,152
    $11,723
    $12,323
    $12,953
    $13,616
    $14,312
    $15,045
    Total Equity Growth
    $15,536
    $16,197
    $16,886
    $17,605
    $18,355
    $19,138
    $19,954
    $20,805
    $21,694
    $22,620
    $23,587
    $24,595
    $25,648
    $26,746
    $27,891
    $29,086
    $30,333
    $31,634
    $32,992
    $34,408
    $35,887
    $37,429
    $39,039
    $40,719
    $42,472
    $44,302
    $46,212
    $48,205
    $50,285
    $52,456
    Annual Tax Savings From Depreciation
    Year 1Year 2Year 3Year 4Year 5Year 6Year 7Year 8Year 9Year 10Year 11Year 12Year 13Year 14Year 15Year 16Year 17Year 18Year 19Year 20Year 21Year 22Year 23Year 24Year 25Year 26Year 27Year 28Year 29Year 30
    Straight Line Depreciation of Cost Basis
    $10,024
    $10,024
    $10,024
    $10,024
    $10,024
    $10,024
    $10,024
    $10,024
    $10,024
    $10,024
    $10,024
    $10,024
    $10,024
    $10,024
    $10,024
    $10,024
    $10,024
    $10,024
    $10,024
    $10,024
    $10,024
    $10,024
    $10,024
    $10,024
    $10,024
    $10,024
    $10,024
    $5,012
    $0
    $0
    Straight Line Depreciaiton of Lender Fees / Points
    $100
    $100
    $100
    $100
    $100
    $100
    $100
    $100
    $100
    $100
    $100
    $100
    $100
    $100
    $100
    $100
    $100
    $100
    $100
    $100
    $100
    $100
    $100
    $100
    $100
    $100
    $100
    $100
    $100
    $100
    Total Straight Line Depreciation
    $10,124
    $10,124
    $10,124
    $10,124
    $10,124
    $10,124
    $10,124
    $10,124
    $10,124
    $10,124
    $10,124
    $10,124
    $10,124
    $10,124
    $10,124
    $10,124
    $10,124
    $10,124
    $10,124
    $10,124
    $10,124
    $10,124
    $10,124
    $10,124
    $10,124
    $10,124
    $10,124
    $5,112
    $100
    $100
    Taxable Income Before Depreciation
    $7,200
    $7,879
    $8,576
    $9,294
    $10,032
    $10,791
    $11,573
    $12,377
    $13,205
    $14,058
    $14,936
    $15,840
    $16,772
    $17,732
    $18,722
    $19,742
    $20,794
    $21,879
    $22,999
    $24,153
    $25,345
    $26,575
    $27,845
    $29,157
    $30,512
    $31,911
    $33,358
    $34,853
    $36,398
    $37,996
    Carry Forward Loss From Depreciation
    $2,924
    $5,169
    $6,716
    $7,547
    $7,639
    $6,972
    $5,523
    $3,270
    $189
    $0
    $0
    $0
    $0
    $0
    $0
    $0
    $0
    $0
    $0
    $0
    $0
    $0
    $0
    $0
    $0
    $0
    $0
    $0
    $0
    $0
    Taxable Income Offset by Depreciation
    $7,200
    $7,879
    $8,576
    $9,294
    $10,032
    $10,791
    $11,573
    $12,377
    $13,205
    $10,313
    $10,124
    $10,124
    $10,124
    $10,124
    $10,124
    $10,124
    $10,124
    $10,124
    $10,124
    $10,124
    $10,124
    $10,124
    $10,124
    $10,124
    $10,124
    $10,124
    $10,124
    $5,112
    $100
    $100
    Remaining Taxable Income After Depreciation
    $0
    $0
    $0
    $0
    $0
    $0
    $0
    $0
    $0
    $3,745
    $4,812
    $5,716
    $6,648
    $7,608
    $8,598
    $9,618
    $10,670
    $11,755
    $12,875
    $14,029
    $15,221
    $16,451
    $17,721
    $19,033
    $20,388
    $21,787
    $23,234
    $29,741
    $36,298
    $37,896
    Federal Income Tax Owed on Rental Income
    $0
    $0
    $0
    $0
    $0
    $0
    $0
    $0
    $0
    $1,198
    $1,540
    $1,829
    $2,127
    $2,435
    $2,751
    $3,078
    $3,414
    $3,762
    $4,120
    $4,489
    $4,871
    $5,264
    $5,671
    $6,091
    $6,524
    $6,972
    $7,435
    $9,517
    $11,615
    $12,127
    Tax Savings from Depreciation
    $2,304
    $2,521
    $2,744
    $2,974
    $3,210
    $3,453
    $3,703
    $3,961
    $4,226
    $3,300
    $3,240
    $3,240
    $3,240
    $3,240
    $3,240
    $3,240
    $3,240
    $3,240
    $3,240
    $3,240
    $3,240
    $3,240
    $3,240
    $3,240
    $3,240
    $3,240
    $3,240
    $1,636
    $32
    $32
    Cash Flow After Taxes
    $3,661
    $4,158
    $4,665
    $5,183
    $5,710
    $6,249
    $6,798
    $7,358
    $7,929
    $7,313
    $7,566
    $7,883
    $8,203
    $8,526
    $8,853
    $9,183
    $9,515
    $9,851
    $10,189
    $10,529
    $10,872
    $11,218
    $11,565
    $11,914
    $12,265
    $12,617
    $12,970
    $11,720
    $10,470
    $10,825
    Performance Over Time
    Year 1Year 2Year 3Year 4Year 5Year 6Year 7Year 8Year 9Year 10Year 11Year 12Year 13Year 14Year 15Year 16Year 17Year 18Year 19Year 20Year 21Year 22Year 23Year 24Year 25Year 26Year 27Year 28Year 29Year 30
    Fair Market Property Value at Year End
    $311,896
    $324,372
    $337,347
    $350,841
    $364,874
    $379,469
    $394,648
    $410,434
    $426,851
    $443,925
    $461,682
    $480,150
    $499,356
    $519,330
    $540,103
    $561,707
    $584,175
    $607,542
    $631,844
    $657,118
    $683,403
    $710,739
    $739,168
    $768,735
    $799,484
    $831,464
    $864,722
    $899,311
    $935,284
    $972,695
    Cumulative Appreciation
    $11,996
    $24,472
    $37,447
    $50,941
    $64,974
    $79,569
    $94,748
    $110,534
    $126,951
    $144,025
    $161,782
    $180,250
    $199,456
    $219,430
    $240,203
    $261,807
    $284,275
    $307,642
    $331,944
    $357,218
    $383,503
    $410,839
    $439,268
    $468,835
    $499,584
    $531,564
    $564,822
    $599,411
    $635,384
    $672,795
    Cumulative Mortgage Principal Paydown
    $3,540
    $7,260
    $11,172
    $15,283
    $19,605
    $24,147
    $28,922
    $33,942
    $39,218
    $44,764
    $50,594
    $56,722
    $63,164
    $69,935
    $77,053
    $84,535
    $92,399
    $100,666
    $109,356
    $118,491
    $128,093
    $138,186
    $148,796
    $159,948
    $171,671
    $183,994
    $196,947
    $210,563
    $224,875
    $239,920
    Total Cumulative Equity
    $75,516
    $91,712
    $108,598
    $126,203
    $144,559
    $163,696
    $183,650
    $204,456
    $226,149
    $248,769
    $272,356
    $296,952
    $322,599
    $349,345
    $377,236
    $406,322
    $436,655
    $468,289
    $501,281
    $535,689
    $571,576
    $609,005
    $648,044
    $688,763
    $731,235
    $775,537
    $821,749
    $869,954
    $920,239
    $972,695
    Cumulative Cash Flow Before Taxes
    $3,661
    $7,819
    $12,484
    $17,666
    $23,377
    $29,625
    $36,423
    $43,780
    $51,709
    $60,221
    $69,327
    $79,038
    $89,369
    $100,330
    $111,934
    $124,194
    $137,124
    $150,736
    $165,045
    $180,064
    $195,807
    $212,289
    $229,525
    $247,530
    $266,319
    $285,907
    $306,312
    $327,549
    $349,634
    $372,585
    Cumulative Tax Savings From Depreciation
    $2,304
    $4,825
    $7,570
    $10,544
    $13,754
    $17,207
    $20,910
    $24,871
    $29,097
    $32,397
    $35,636
    $38,876
    $42,116
    $45,356
    $48,595
    $51,835
    $55,075
    $58,314
    $61,554
    $64,794
    $68,033
    $71,273
    $74,513
    $77,752
    $80,992
    $84,232
    $87,471
    $89,107
    $89,139
    $89,171
    Cumulative Cash Flow After Taxes
    $3,661
    $7,819
    $12,484
    $17,666
    $23,377
    $29,625
    $36,423
    $43,780
    $51,709
    $59,022
    $66,588
    $74,471
    $82,674
    $91,200
    $100,053
    $109,236
    $118,751
    $128,602
    $138,790
    $149,320
    $160,192
    $171,410
    $182,975
    $194,889
    $207,154
    $219,771
    $232,740
    $244,460
    $254,930
    $265,755
    Total Net Profit if Sold
    -
    $7,601
    $28,114
    $49,823
    $72,765
    $96,984
    $122,521
    $149,421
    $177,730
    $206,298
    $236,030
    $267,031
    $299,345
    $333,019
    $368,101
    $404,641
    $442,692
    $482,307
    $523,543
    $566,459
    $611,116
    $657,576
    $705,905
    $756,173
    $808,451
    $862,811
    $919,332
    $976,489
    $1,034,366
    $1,094,654
    Total Return on Investment if Sold
    -
    11.52%
    42.61%
    75.51%
    110.28%
    146.99%
    185.69%
    226.46%
    269.37%
    312.67%
    357.73%
    404.72%
    453.69%
    504.73%
    557.9%
    613.28%
    670.95%
    730.99%
    793.49%
    858.53%
    926.21%
    996.63%
    1069.88%
    1146.06%
    1225.3%
    1307.69%
    1393.35%
    1479.98%
    1567.7%
    1659.07%
    Before-Tax Return on Investment if Held
    29.1%
    30.8%
    32.7%
    34.5%
    36.5%
    38.5%
    40.5%
    42.7%
    44.9%
    47.2%
    49.5%
    52%
    54.5%
    57.1%
    59.9%
    62.7%
    65.6%
    68.6%
    71.7%
    74.9%
    78.3%
    81.7%
    85.3%
    89%
    92.8%
    96.8%
    101%
    105.2%
    109.7%
    114.3%
    After-Tax Return on Investment if Held
    29.1%
    30.8%
    32.7%
    34.5%
    36.5%
    38.5%
    40.5%
    42.7%
    44.9%
    45.4%
    47.2%
    49.2%
    51.3%
    53.5%
    55.7%
    58%
    60.4%
    62.9%
    65.4%
    68.1%
    70.9%
    73.7%
    76.7%
    79.8%
    83%
    86.3%
    89.7%
    90.8%
    92.1%
    95.9%