Welcome to Wichita!
Wichita, Kansas is a smaller market with big advantages over larger metro areas. Unlike big cities where Wall Street firms have driven up prices, Wichita’s cost of housing is still 34% below the national average and the rent-to-value ratios remain strong. It is also a regional economic hub anchored by world-class aerospace and advanced manufacturing employers with a steadily growing population. Wichita’s housing market continues to appreciate year over year, showing consistent growth without the wild swings seen on the coasts. On top of that, Wichita’s overall cost of living is 11% lower than the national average.
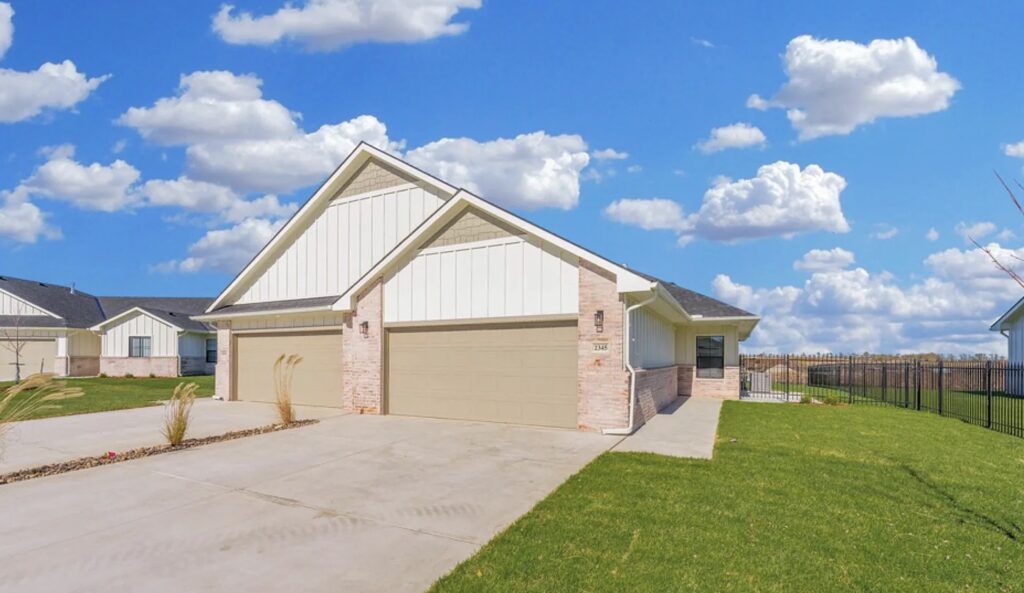
W Elk Ridge Ave Goddard, KS
Reservation Terms:
Request to Submit an Offer to Purchase. The Prospective Purchaser requests the right to submit an Offer to Purchase the above specified property from the Seller. The Seller may solicit similar reservations from other Prospective Purchasers and may take as many reservations as Seller deems appropriate.
Purchase Contract and Earnest Money Deposit. Upon receipt of this reservation, the Seller may send to Prospective Purchaser a Purchase and Sale Agreement as well as instructions on where to send an Earnest Money Deposit that will be governed by the terms of the Purchase and Sale Agreement signed between Seller and Prospective Purchaser.
Not a Sale. By execution of this Reservation, the Prospective Purchaser shall not obtain any interest in the property. This Reservation is not a contract for the sale of real property.
Obligation. The Prospective Purchaser has no obligation under this Reservation unless and until the Prospective Purchaser enters into a Purchase and Sale Agreement with the Seller. In such event, the terms and conditions of the Purchase and Sale Agreement shall supersede the terms and conditions of this Reservation and this Reservation shall terminate and be in no further force or effect with the exception of the “Non-Representation and Indemnity of Referring Brokerage” clause which shall remain in effect.
- The Prospective Purchaser does not enter into a written Purchase and Sale Agreement for the specified property
- The Purchase and Sale Agreement is rejected by the Seller for any reason.
Transfer or Assignment. The rights of the Prospective Purchaser hereunder may not be transferred or assigned without the express written consent of the Seller, which consent may be withheld for any reason. Any attempt to transfer or assign this Reservation prior to such written approval shall automatically terminate this Reservation and the Prospective Purchaser shall have no further rights hereunder.
Non-Representation and Indemnity of Referring Brokerage. Maverick Investor Group, LLC (“Maverick”) does not represent the Prospective Purchaser in any capacity and has made no statements, promises or representations regarding the real property. Nor does Maverick represent the Seller in any capacity. Maverick’s only role has been to refer the Prospective Purchaser to the Seller. Prospective Purchaser agrees to indemnify, defend and hold Maverick harmless from all claims, damages, costs, etc. (including attorney’s fees) relating to any real property transaction between Seller and Prospective Purchaser. Furthermore, Prospective Purchaser agrees that Maverick has introduced them to a buying opportunity for real property only and not to a securities offering.


OFFERED BY THE SELLER
- 1 Year Builder Warranty
- Manufacturer Warranties
- 1 Year No HOA Fees
- 1 Year Free Property Management (with use of Seller’s PM)
Snapshot Financials
Estimated Property Taxes
Estimated Insurance
Home Owners Association Fee
Property Management Fee
Based on 5%
Based on 4%
Total Monthly Expenses
Monthly Net Operating Income ('NOI') = Monthly Gross Scheduled Rent - Monthly Operating Expenses - 5% Maintenance Estimate - 7% Vacancy Estimates. NOI does not take into account any financing that you may be using. The NOI is always an 'estimate' and can never be guaranteed because it includes the non-fixed variables of 'maintenance' and 'vacancy' which vary over time.
Capitalization Rate ('Cap Rate') = Annual Net Operating Income / Purchase Price. Cap Rate does not take into account any financing you may be using nor any closing costs you may be paying.
Gross Rent Multiplier ('GRM') = Purchase Price / Annual Gross Scheduled Rent. GRM is only a price to rent ratio and does not take into account any operating expenses, financing, closing cost payments or maintenance and vacancy assumptions. And remember, GRM is like a golf score, the lower the better.
Property Features
Reservation Terms:
Request to Submit an Offer to Purchase. The Prospective Purchaser requests the right to submit an Offer to Purchase the above specified property from the Seller. The Seller may solicit similar reservations from other Prospective Purchasers and may take as many reservations as Seller deems appropriate.
Purchase Contract and Earnest Money Deposit. Upon receipt of this reservation, the Seller may send to Prospective Purchaser a Purchase and Sale Agreement as well as instructions on where to send an Earnest Money Deposit that will be governed by the terms of the Purchase and Sale Agreement signed between Seller and Prospective Purchaser.
Not a Sale. By execution of this Reservation, the Prospective Purchaser shall not obtain any interest in the property. This Reservation is not a contract for the sale of real property.
Obligation. The Prospective Purchaser has no obligation under this Reservation unless and until the Prospective Purchaser enters into a Purchase and Sale Agreement with the Seller. In such event, the terms and conditions of the Purchase and Sale Agreement shall supersede the terms and conditions of this Reservation and this Reservation shall terminate and be in no further force or effect with the exception of the “Non-Representation and Indemnity of Referring Brokerage” clause which shall remain in effect.
- The Prospective Purchaser does not enter into a written Purchase and Sale Agreement for the specified property
- The Purchase and Sale Agreement is rejected by the Seller for any reason.
Transfer or Assignment. The rights of the Prospective Purchaser hereunder may not be transferred or assigned without the express written consent of the Seller, which consent may be withheld for any reason. Any attempt to transfer or assign this Reservation prior to such written approval shall automatically terminate this Reservation and the Prospective Purchaser shall have no further rights hereunder.
Non-Representation and Indemnity of Referring Brokerage. Maverick Investor Group, LLC (“Maverick”) does not represent the Prospective Purchaser in any capacity and has made no statements, promises or representations regarding the real property. Nor does Maverick represent the Seller in any capacity. Maverick’s only role has been to refer the Prospective Purchaser to the Seller. Prospective Purchaser agrees to indemnify, defend and hold Maverick harmless from all claims, damages, costs, etc. (including attorney’s fees) relating to any real property transaction between Seller and Prospective Purchaser. Furthermore, Prospective Purchaser agrees that Maverick has introduced them to a buying opportunity for real property only and not to a securities offering.
Agent Reservation Terms:
Request to Submit an Offer to Purchase on Behalf of Your Client. Your Prospective Purchaser requests the right to submit an Offer to Purchase the above specified property from the Seller. The Seller may solicit similar reservations from other Prospective Purchasers and may take as many reservations as Seller deems appropriate.
No Maverick Communication With Your Prospective Purchaser. Submission of this form will send your Prospective Purchaser’s request to purchase to the seller directly. It will NOT trigger any communication to your Prospective Purchaser from Maverick and (as long as they are not already a client of ours) it will automatically tag them in the Maverick database as “Do Not Email” so they will receive no email correspondence from Maverick in the future either.
Purchase Contract and Earnest Money Deposit. Upon receipt of this reservation, if the property is still available, the Seller will send your Prospective Purchaser a Purchase and Sale Agreement as well as instructions on where to send an Earnest Money Deposit that will be governed by the terms of the Purchase and Sale Agreement signed between Seller and Prospective Purchaser.
Not a Sale. By submission of this Reservation, your Prospective Purchaser shall not obtain any interest in the property. This Reservation is not a contract for the sale of real property.
Obligation. Your Prospective Purchaser has no obligation under this Reservation unless and until the Prospective Purchaser enters into a Purchase and Sale Agreement with the Seller.
- The Prospective Purchaser does not enter into a written Purchase and Sale Agreement for the specified property.
- The Purchase and Sale Agreement is rejected by the Seller for any reason.
Transfer or Assignment. The rights of the Prospective Purchaser hereunder may not be transferred or assigned without the express written consent of the Seller.
Non-Representation and Indemnity of Referring Brokerage. Maverick Investor Group, LLC (“Maverick”) does not represent you or your Prospective Purchaser in any capacity and has made no statements, promises or representations regarding the real property. Nor does Maverick represent the Seller in any capacity. Maverick’s only role has been to refer you and/or your Prospective Purchaser to the Seller. You agrees to indemnify, defend and hold Maverick harmless from all claims, damages, costs, etc. (including attorney’s fees) relating to any real property transaction between Seller and Prospective Purchaser. Furthermore, you agree that Maverick has introduced you and/or your Prospective Purchaser to a buying opportunity for real property only and not to a securities offering.
Seller's Additional Notes
Brand new Class A duplex. Each unit is 3-bedroom, 2-bathroom, 2-car garage and are located in the charming town of Goddard, KS (suburb of Wichita). This property boasts a range of modern amenities that cater to a comfortable and convenient lifestyle. The home features a spacious fenced yard, perfect for outdoor activities and secure off-street parking in a 2-car garage. Inside, you’ll find washer/dryer connections for your laundry needs, and a kitchen equipped with stainless steel appliances, including a gas range, for all your culinary adventures. The kitchen is further enhanced with sleek quartz countertops, adding a touch of elegance to the space. The home also comes with an irrigation system, ensuring a lush and green yard all year round.
Wichita Highlights
Wichita Properties:
- New Construction Duplexes and Townhomes in Class A Neighborhoods
- Quartz Countertops and Stainless Steel Appliances
- Tenants and Local Property Management in Place
- 5.5%+ Average Cap Rates
- $217,500 Starting Purchase Price
Wichita Market:
- Cost of living 11% below the national average
- Cost of housing 34% below the national average.
- Economy anchored by world-class aerospace and manufacturing companies
- Ranked #1 MSA for % of “very high-tech” manufacturing jobs
- Excellent K-12 school districts that consistently attract families.
Similar
Properties
Maverick Property Vault
- Type: Townhouse
- Rent: $1645 Per Month
- Cap Rate: 5.8%
- Year Built: 2025
- 3 Bedrooms
- 1216 Sq Ft
- 2.0 Bathrooms
- 2 Car Garage
- Type: Townhouse
- Rent: $1795 Per Month
- Cap Rate: 5.6%
- Year Built: 2025
- 3 Bedrooms
- 1470 Sq Ft
- 2.0 Bathrooms
- 2 Car Garage
- Type: Duplex
- Rent: $3290 Per Month
- Cap Rate: 5.8%
- Year Built: 2025
- 6 Bedrooms
- 2432 Sq Ft
- 4.0 Bathrooms
- 2 Car Garage
- Type: Duplex
- Rent: $3390 Per Month
- Cap Rate: 5.2%
- Year Built: 2025
- 6 Bedrooms
- 2940 Sq Ft
- 4.0 Bathrooms
- 2 Car Garage
- Type: Duplex
- Rent: $3290 Per Month
- Cap Rate: 5.5%
- Year Built: 2025
- 6 Bedrooms
- 2736 Sq Ft
- 4.0 Bathrooms
- 2 Car Garage
- Type: Duplex
- Rent: $3590 Per Month
- Cap Rate: 5.5%
- Year Built: 2025
- 6 Bedrooms
- 2910 Sq Ft
- 4.0 Bathrooms
- 2 Car Garage
More Maverick Markets
Subscribe
GET Access TO Private buying opportunities for TURNKEY Rental properies & EDUCATIONAL RESOURCES. READ OUR PRIVACY NOTICE & TERMS OF USE.