Own Cash-Flowing Rental Properties in the Best U.S. Markets From Anywhere!

Search
Close this search box.

Welcome to St. Louis!

ABOUT St. Louis

St. Louis is such a uniquely advantageous market for real estate investors right now because of its optimal price-to-rent ratios and low cost of living. Home to 8 Fortune 500 companies and an unemployment rate well below the national average, the GDP in St. Louis increased 29% in the last decade and is now over $170 Billion! (Source: FRBSTL) Multiple sectors are experiencing job growth including over $1 Billion in Venture Capital injected into its Tech sector since 2014 alone! (Source: St. Louis Regional Chamber)

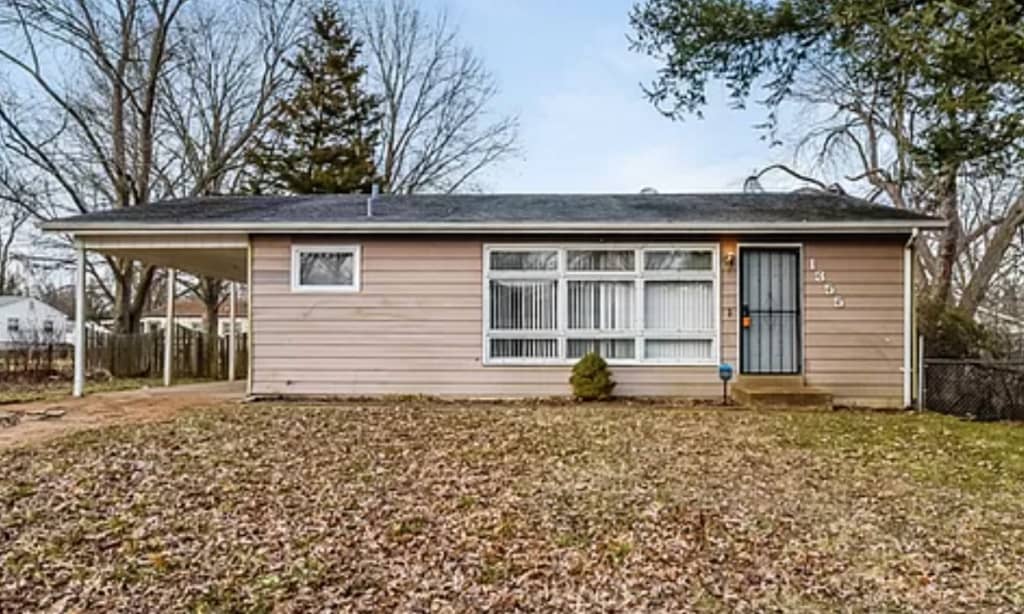
Widefields Lane Saint Louis, MO

RESERVE THIS PROPERTY

OFFERED BY THE SELLER

  • 1-Year Home Warranty (Issued by 3rd Party).

Snapshot Financials

Price:
$ 120000
Rent:
$ 1200 / mo
Taxes:

Estimated Property Taxes

$ 97.8333
Insurance:

Estimated Insurance

$ 800
HOA Fee:

Home Owners Association Fee

$ 0
PM Fee:

Property Management Fee

$ 120
Other:
$ 0
Other:
$ 0
Vacancy:

Based on 7%

$ 84
Repairs:

Based on 5%

$ 60
Total:

Total Monthly Expenses

$ 428.5
NOI:

Monthly Net Operating Income ('NOI') = Monthly Gross Scheduled Rent - Monthly Operating Expenses - 5% Maintenance Estimate - 7% Vacancy Estimates. NOI does not take into account any financing that you may be using. The NOI is always an 'estimate' and can never be guaranteed because it includes the non-fixed variables of 'maintenance' and 'vacancy' which vary over time.

$ 772 / mo
Cap Rate:

Capitalization Rate ('Cap Rate') = Annual Net Operating Income / Purchase Price. Cap Rate does not take into account any financing you may be using nor any closing costs you may be paying.

7.72 %
GRM:

Gross Rent Multiplier ('GRM') = Purchase Price / Annual Gross Scheduled Rent. GRM is only a price to rent ratio and does not take into account any operating expenses, financing, closing cost payments or maintenance and vacancy assumptions. And remember, GRM is like a golf score, the lower the better.
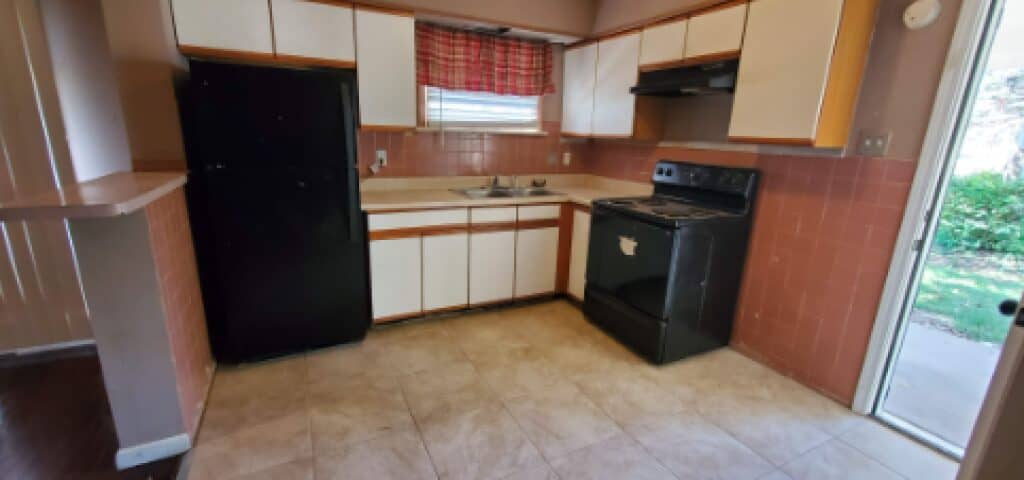
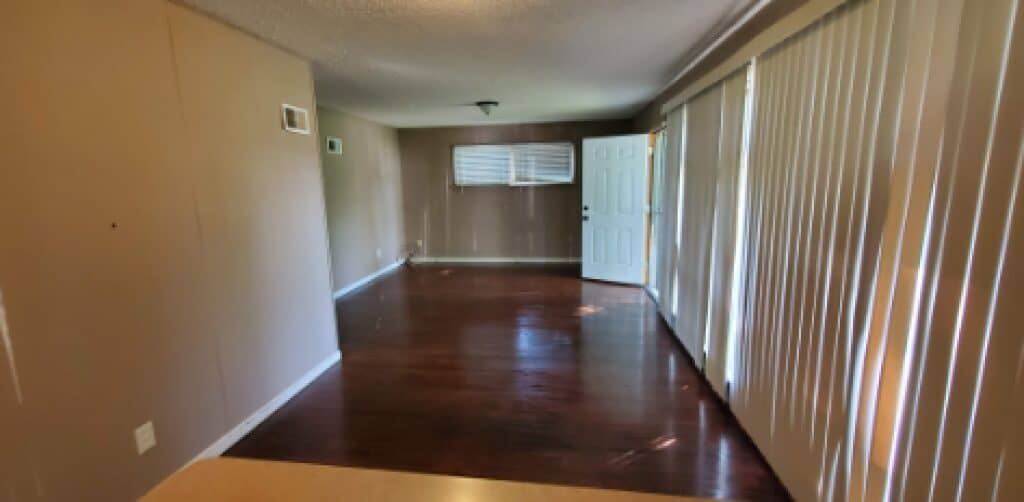
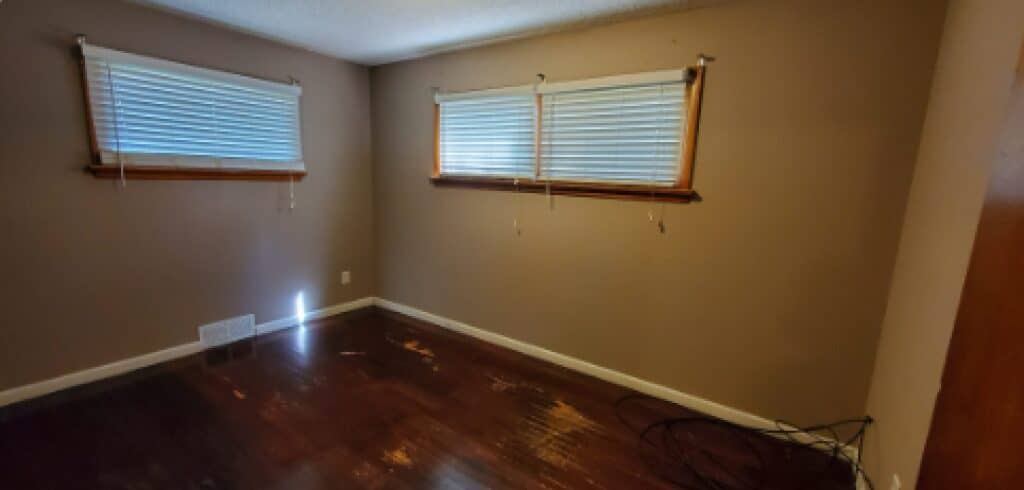
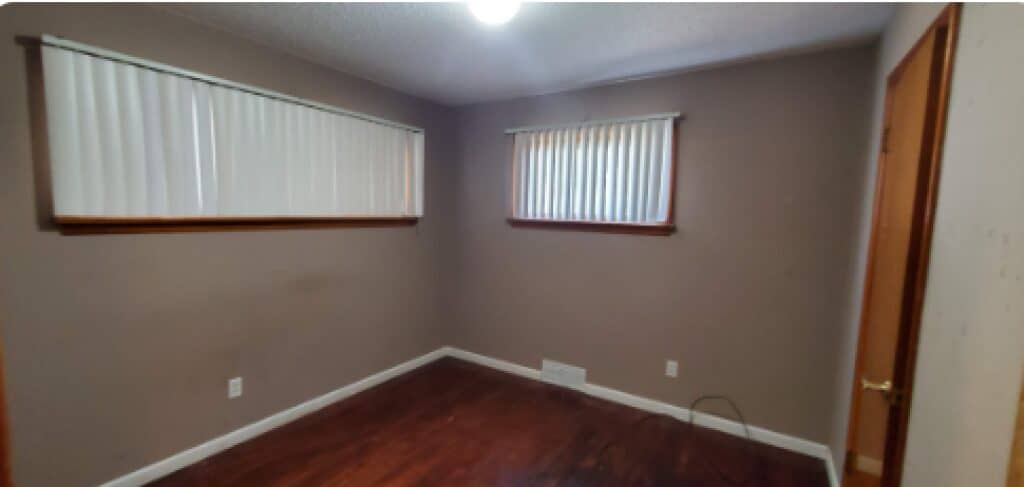
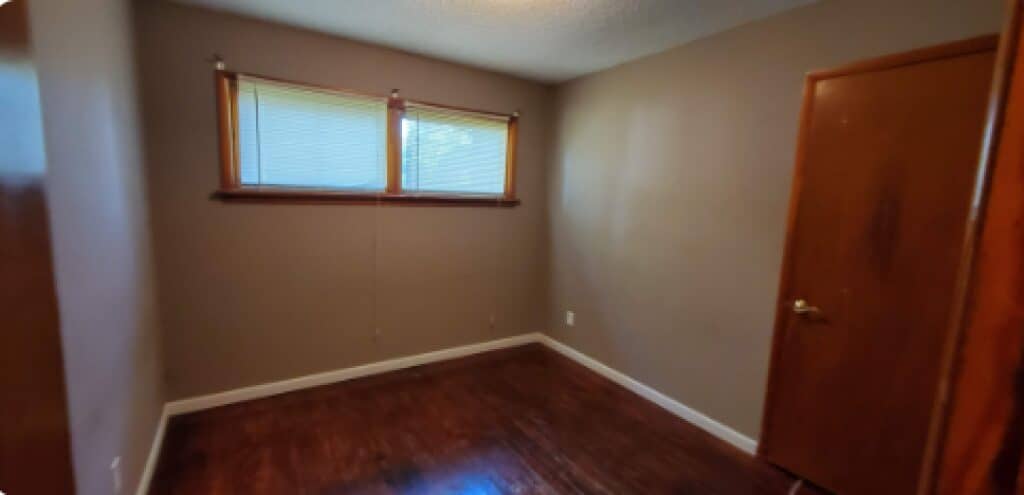
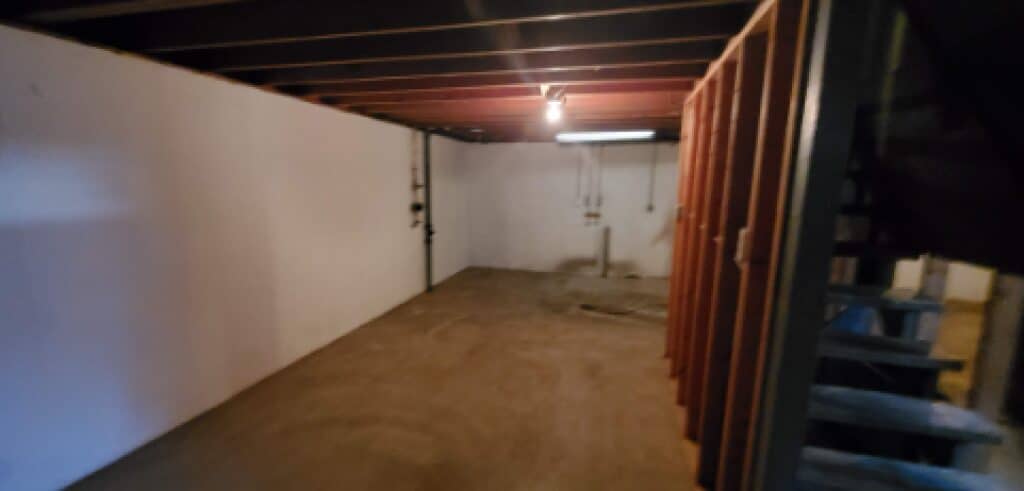
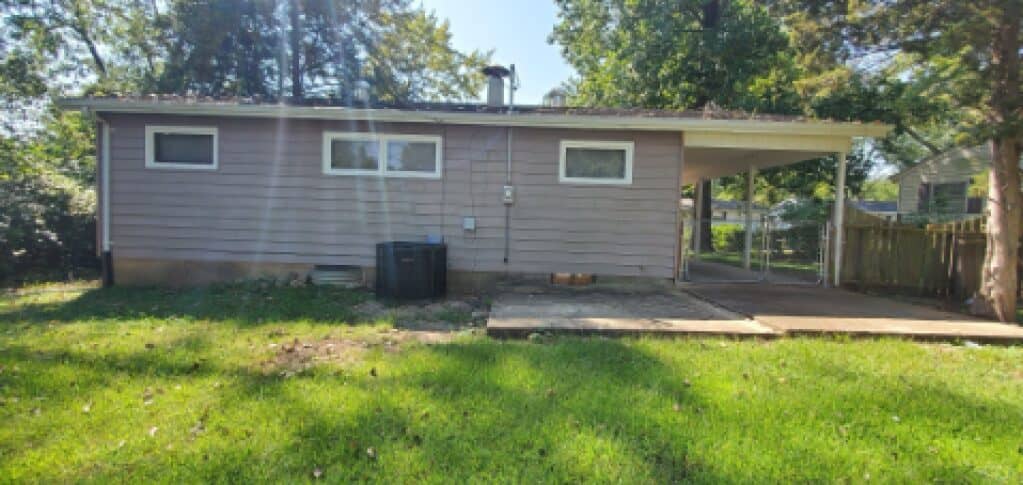
8.33

Property Features

Type:
Single Family Home
Condition:
Fully Renovated as Condition of Closing
Rental Status:
Tenant in Place as Condition of Closing
Year Built:
1957
Bedrooms:
3
Bathrooms:
1.0
Floor Area:
1008 Sq Ft
Lot Size:
0.17 Acres
Stories:
1 Story
Basement:
No Basement
Parking:
Carport Parking
RESERVE THIS PROPERTY

Seller's Additional Notes

This property is in the nice community of Spanish Lake MO. Property will be completely renovated up to local code.

All information provided is for informational purposes. Projected Rent is calculated using a nationwide database and is subject to change.

St. Louis Highlights

St. Louis Properties:

  • Fully-Renovated Single Family Rental Properties
  • Tenants and Property Management in Place as Condition of Closing
  • High demand areas with a solid mix of tenants and owner occupants
  • $135,000 Average Purchase Price
  • 7% Average Cap Rates

St. Louis Market:

  • Lower Than Average Unemployment
  • Home to 8 Fortune 500 Companies
  • $170+ Billion GDP (29% increase in the last decade)
  • Lower Than Average Cost of Living

Similar
Properties

Maverick Property Vault

$822 Net Operating Income
$836 Net Operating Income
$755 Net Operating Income
$816 Net Operating Income
$750 Net Operating Income
$833 Net Operating Income
No more properties to show

More Maverick Markets

Subscribe

    GET Access TO Private buying opportunities for TURNKEY Rental properies & EDUCATIONAL RESOURCES. READ OUR PRIVACY NOTICE & TERMS OF USE.

    Maverick's Cash-Flow Calculator

    DISCLAIMER
    OPEN

    This calculator is for recreational use only and is NOT financial or accounting software. There are a litany of variables that may be relevant to determining your individual tax obligations, financial performance and investment returns on a rental property that are NOT factored into this calculator. By using this calculator, you understand that the numbers herein are NOT specific projections of what your returns will actually be, and you agree that it is YOUR DUTY to consult with your own tax and financial professionals about the evaluation, risk assessment, realistic financial expectations, and actual tax obligations associated with any real estate investment. You also understand that ALL real estate investing involves risk, which buyer assumes 100%, and that no specific returns can ever be guaranteed by anyone.

    Top

    INSTRUCTIONS

    Click into any Investor INPUTS (THE ORANGE FIELDS) to modify.
    Click any field LABEL to view a definition.
    Click CALCULATE to update financial calculations on ALL TABS.
    Purchase
    Monthly Cashflow
    Tax Benefits
    Future Assumptions

    INSTRUCTIONS

    Click into any Investor INPUTS (THE ORANGE FIELDS) to modify.
    Click any field LABEL to view a definition.
    Click CALCULATE to update financial calculations on ALL TABS.
    Cash to Purchase
    Purchase Price
    $120,000
    Fair Market Value
    $120,000
    Down Payment Amount
    $24,000
    Depreciable Closing Costs
    $3,000
    Lender Fees / Points
    $3,000
    Total Cash Invested
    $30,000
    Total Equity at Purchase
    $24,000
    Morgage Calculation
    Loan Amount
    $96,000
    Monthly Mortgage Payment
    $515
    First Year Mortgage Principal Paid Down
    $1,416
    First Year Mortgage Interest Paid
    $4,768

    INSTRUCTIONS

    Click into any Investor INPUTS (THE ORANGE FIELDS) to modify.
    Click any field LABEL to view a definition.
    Click CALCULATE to update financial calculations on ALL TABS.
    First Year Monthly Cashflow
    Gross Scheduled Rent
    $1,200
    Vacancy Estimate
    $84
    Gross Operating Income
    $1,116
    Property Taxes
    $150
    Insurance
    $50
    Other Expense
    $0
    Owner-Paid Utilities / Landscaping
    $0
    Property Management Fee
    $120
    Maintenance Estimate
    $60
    Total Operating Expenses
    $380
    Net Operating Income (NOI)
    $736
    Mortgage Payment
    $515
    Cash Flow Before Taxes
    $221
    Gross Rent Multiplier (GRM)
    8.3
    Rent to Value Ratio (RV Ratio)
    1%
    Capitalization Rate (Cap Rate)
    7.4%
    Cash on Cash Return
    8.8%

    INSTRUCTIONS

    Click into any Investor INPUTS (THE ORANGE FIELDS) to modify.
    Click any field LABEL to view a definition.
    Click CALCULATE to update financial calculations on ALL TABS.
    Tax Benefits
    Value of (Non-Depreciable) Land
    $12,000
    Value of (Depreciable) Property Structure
    $108,000
    Depreciable "Cost Basis" at Purchase
    $111,000
    Annual Straight Line Depreciation of Cost Basis
    $4,036
    Annual Depreciation of Lender Fees / Costs
    $100
    First Year Total Depreciation
    $4,136
    First Year Taxable Income Before Depreciation
    $4,064
    First Year Taxable Income Offset by Depreciation
    $4,064
    First Year Remaining Taxable Income After Depreciation
    $0
    First Year Federal Income Taxes Owed on Rental Income
    $0
    First Year Tax Savings from Depreciation on Rental Income
    $1,301
    First Year Left Over Depreciation
    $72

    INSTRUCTIONS

    Click into any Investor INPUTS (THE ORANGE FIELDS) to modify.
    Click any field LABEL to view a definition.
    Click CALCULATE to update financial calculations on ALL TABS.
    (Swipe left or right to scroll horizontally)
    Annual Income
    Year 1Year 2Year 3Year 4Year 5Year 6Year 7Year 8Year 9Year 10Year 11Year 12Year 13Year 14Year 15Year 16Year 17Year 18Year 19Year 20Year 21Year 22Year 23Year 24Year 25Year 26Year 27Year 28Year 29Year 30
    Gross Scheduled Rent
    $14,400
    $14,688
    $14,982
    $15,281
    $15,587
    $15,899
    $16,217
    $16,541
    $16,872
    $17,209
    $17,554
    $17,905
    $18,263
    $18,628
    $19,000
    $19,381
    $19,768
    $20,163
    $20,567
    $20,978
    $21,398
    $21,826
    $22,262
    $22,707
    $23,161
    $23,625
    $24,097
    $24,579
    $25,071
    $25,572
    Vacancy Loss
    $1,008
    $1,028
    $1,049
    $1,070
    $1,091
    $1,113
    $1,135
    $1,158
    $1,181
    $1,205
    $1,229
    $1,253
    $1,278
    $1,304
    $1,330
    $1,357
    $1,384
    $1,411
    $1,440
    $1,468
    $1,498
    $1,528
    $1,558
    $1,590
    $1,621
    $1,654
    $1,687
    $1,721
    $1,755
    $1,790
    Gross Operating Income
    $13,392
    $13,660
    $13,933
    $14,212
    $14,496
    $14,786
    $15,082
    $15,383
    $15,691
    $16,005
    $16,325
    $16,651
    $16,984
    $17,324
    $17,670
    $18,024
    $18,384
    $18,752
    $19,127
    $19,510
    $19,900
    $20,298
    $20,704
    $21,118
    $21,540
    $21,971
    $22,410
    $22,859
    $23,316
    $23,782
    Annual Operating Expenses
    Year 1Year 2Year 3Year 4Year 5Year 6Year 7Year 8Year 9Year 10Year 11Year 12Year 13Year 14Year 15Year 16Year 17Year 18Year 19Year 20Year 21Year 22Year 23Year 24Year 25Year 26Year 27Year 28Year 29Year 30
    Property Taxes
    $1,800
    $1,800
    $1,800
    $1,800
    $1,800
    $1,800
    $1,800
    $1,800
    $1,800
    $1,800
    $1,800
    $1,800
    $1,800
    $1,800
    $1,800
    $1,800
    $1,800
    $1,800
    $1,800
    $1,800
    $1,800
    $1,800
    $1,800
    $1,800
    $1,800
    $1,800
    $1,800
    $1,800
    $1,800
    $1,800
    Insurance
    $600
    $600
    $600
    $600
    $600
    $600
    $600
    $600
    $600
    $600
    $600
    $600
    $600
    $600
    $600
    $600
    $600
    $600
    $600
    $600
    $600
    $600
    $600
    $600
    $600
    $600
    $600
    $600
    $600
    $600
    Maintenance Assumption
    $720
    $734
    $749
    $764
    $779
    $795
    $811
    $827
    $844
    $860
    $878
    $895
    $913
    $931
    $950
    $969
    $988
    $1,008
    $1,028
    $1,049
    $1,070
    $1,091
    $1,113
    $1,135
    $1,158
    $1,181
    $1,205
    $1,229
    $1,254
    $1,279
    Property Management
    $1,440
    $1,469
    $1,498
    $1,528
    $1,559
    $1,590
    $1,622
    $1,654
    $1,687
    $1,721
    $1,755
    $1,790
    $1,826
    $1,863
    $1,900
    $1,938
    $1,977
    $2,016
    $2,057
    $2,098
    $2,140
    $2,183
    $2,226
    $2,271
    $2,316
    $2,362
    $2,410
    $2,458
    $2,507
    $2,557
    Owner-Paid Utilities / Landscaping
    $0
    $0
    $0
    $0
    $0
    $0
    $0
    $0
    $0
    $0
    $0
    $0
    $0
    $0
    $0
    $0
    $0
    $0
    $0
    $0
    $0
    $0
    $0
    $0
    $0
    $0
    $0
    $0
    $0
    $0
    Other Expense
    $0
    $0
    $0
    $0
    $0
    $0
    $0
    $0
    $0
    $0
    $0
    $0
    $0
    $0
    $0
    $0
    $0
    $0
    $0
    $0
    $0
    $0
    $0
    $0
    $0
    $0
    $0
    $0
    $0
    $0
    Total Operating Expenses
    $4,560
    $4,603
    $4,647
    $4,692
    $4,738
    $4,785
    $4,833
    $4,881
    $4,931
    $4,981
    $5,033
    $5,086
    $5,139
    $5,194
    $5,250
    $5,307
    $5,365
    $5,425
    $5,485
    $5,547
    $5,610
    $5,674
    $5,739
    $5,806
    $5,874
    $5,944
    $6,015
    $6,087
    $6,161
    $6,236
    Annual Debt Service
    Year 1Year 2Year 3Year 4Year 5Year 6Year 7Year 8Year 9Year 10Year 11Year 12Year 13Year 14Year 15Year 16Year 17Year 18Year 19Year 20Year 21Year 22Year 23Year 24Year 25Year 26Year 27Year 28Year 29Year 30
    Debt Service
    $6,184
    $6,184
    $6,184
    $6,184
    $6,184
    $6,184
    $6,184
    $6,184
    $6,184
    $6,184
    $6,184
    $6,184
    $6,184
    $6,184
    $6,184
    $6,184
    $6,184
    $6,184
    $6,184
    $6,184
    $6,184
    $6,184
    $6,184
    $6,184
    $6,184
    $6,184
    $6,184
    $6,184
    $6,184
    $6,184
    Mortgage Balance at Year End
    $94,584
    $93,095
    $91,530
    $89,885
    $88,156
    $86,338
    $84,427
    $82,419
    $80,308
    $78,088
    $75,756
    $73,304
    $70,726
    $68,017
    $65,169
    $62,175
    $59,028
    $55,720
    $52,243
    $48,588
    $44,746
    $40,707
    $36,462
    $31,999
    $27,309
    $22,378
    $17,195
    $11,747
    $6,020
    -
    Debt Service Coverage Ratio
    1.43%
    1.46%
    1.5%
    1.54%
    1.58%
    1.62%
    1.66%
    1.7%
    1.74%
    1.78%
    1.83%
    1.87%
    1.92%
    1.96%
    2.01%
    2.06%
    2.11%
    2.16%
    2.21%
    2.26%
    2.31%
    2.36%
    2.42%
    2.48%
    2.53%
    2.59%
    2.65%
    2.71%
    2.77%
    2.84%
    Annual Capital Improvements
    Year 1Year 2Year 3Year 4Year 5Year 6Year 7Year 8Year 9Year 10Year 11Year 12Year 13Year 14Year 15Year 16Year 17Year 18Year 19Year 20Year 21Year 22Year 23Year 24Year 25Year 26Year 27Year 28Year 29Year 30
    Capital Improvements
    $0
    $0
    $0
    $0
    $0
    $0
    $0
    $0
    $0
    $0
    $0
    $0
    $0
    $0
    $0
    $0
    $0
    $0
    $0
    $0
    $0
    $0
    $0
    $0
    $0
    $0
    $0
    $0
    $0
    $0
    Annual Cash Flow Analysis
    Year 1Year 2Year 3Year 4Year 5Year 6Year 7Year 8Year 9Year 10Year 11Year 12Year 13Year 14Year 15Year 16Year 17Year 18Year 19Year 20Year 21Year 22Year 23Year 24Year 25Year 26Year 27Year 28Year 29Year 30
    Net Operating Income
    $8,832
    $9,057
    $9,286
    $9,519
    $9,758
    $10,001
    $10,249
    $10,502
    $10,760
    $11,023
    $11,292
    $11,566
    $11,845
    $12,130
    $12,420
    $12,717
    $13,019
    $13,328
    $13,642
    $13,963
    $14,290
    $14,624
    $14,964
    $15,312
    $15,666
    $16,027
    $16,396
    $16,772
    $17,155
    $17,546
    Capitalization Rate
    7.4%
    7.5%
    7.7%
    7.9%
    8.1%
    8.3%
    8.5%
    8.8%
    9%
    9.2%
    9.4%
    9.6%
    9.9%
    10.1%
    10.4%
    10.6%
    10.8%
    11.1%
    11.4%
    11.6%
    11.9%
    12.2%
    12.5%
    12.8%
    13.1%
    13.4%
    13.7%
    14%
    14.3%
    14.6%
    Cash Flow Before Taxes
    $2,648
    $2,872
    $3,102
    $3,335
    $3,574
    $3,817
    $4,065
    $4,318
    $4,576
    $4,839
    $5,108
    $5,381
    $5,661
    $5,946
    $6,236
    $6,533
    $6,835
    $7,143
    $7,458
    $7,779
    $8,106
    $8,440
    $8,780
    $9,128
    $9,482
    $9,843
    $10,212
    $10,588
    $10,971
    $11,362
    Cash on Cash Return
    8.8%
    9.6%
    10.3%
    11.1%
    11.9%
    12.7%
    13.5%
    14.4%
    15.3%
    16.1%
    17%
    17.9%
    18.9%
    19.8%
    20.8%
    21.8%
    22.8%
    23.8%
    24.9%
    25.9%
    27%
    28.1%
    29.3%
    30.4%
    31.6%
    32.8%
    34%
    35.3%
    36.6%
    37.9%
    Annual Equity Accumulation
    Year 1Year 2Year 3Year 4Year 5Year 6Year 7Year 8Year 9Year 10Year 11Year 12Year 13Year 14Year 15Year 16Year 17Year 18Year 19Year 20Year 21Year 22Year 23Year 24Year 25Year 26Year 27Year 28Year 29Year 30
    Property Appreciation
    $4,800
    $4,992
    $5,192
    $5,399
    $5,615
    $5,840
    $6,074
    $6,316
    $6,569
    $6,832
    $7,105
    $7,389
    $7,685
    $7,992
    $8,312
    $8,645
    $8,990
    $9,350
    $9,724
    $10,113
    $10,517
    $10,938
    $11,376
    $11,831
    $12,304
    $12,796
    $13,308
    $13,840
    $14,394
    $14,970
    Mortgage Principal Pay Down
    $1,416
    $1,489
    $1,565
    $1,645
    $1,729
    $1,818
    $1,911
    $2,008
    $2,111
    $2,219
    $2,333
    $2,452
    $2,578
    $2,709
    $2,848
    $2,994
    $3,147
    $3,308
    $3,477
    $3,655
    $3,842
    $4,039
    $4,245
    $4,462
    $4,691
    $4,931
    $5,183
    $5,448
    $5,727
    $6,020
    Total Equity Growth
    $6,216
    $6,481
    $6,757
    $7,044
    $7,345
    $7,658
    $7,984
    $8,325
    $8,680
    $9,051
    $9,438
    $9,841
    $10,262
    $10,702
    $11,160
    $11,638
    $12,137
    $12,658
    $13,201
    $13,768
    $14,359
    $14,977
    $15,621
    $16,293
    $16,995
    $17,727
    $18,491
    $19,288
    $20,121
    $20,989
    Annual Tax Savings From Depreciation
    Year 1Year 2Year 3Year 4Year 5Year 6Year 7Year 8Year 9Year 10Year 11Year 12Year 13Year 14Year 15Year 16Year 17Year 18Year 19Year 20Year 21Year 22Year 23Year 24Year 25Year 26Year 27Year 28Year 29Year 30
    Straight Line Depreciation of Cost Basis
    $4,136
    $4,136
    $4,136
    $4,136
    $4,136
    $4,136
    $4,136
    $4,136
    $4,136
    $4,136
    $4,136
    $4,136
    $4,136
    $4,136
    $4,136
    $4,136
    $4,136
    $4,136
    $4,136
    $4,136
    $4,136
    $4,136
    $4,136
    $4,136
    $4,136
    $4,136
    $4,136
    $2,068
    $0
    $0
    Straight Line Depreciaiton of Lender Fees / Points
    $100
    $100
    $100
    $100
    $100
    $100
    $100
    $100
    $100
    $100
    $100
    $100
    $100
    $100
    $100
    $100
    $100
    $100
    $100
    $100
    $100
    $100
    $100
    $100
    $100
    $100
    $100
    $100
    $100
    $100
    Total Straight Line Depreciation
    $4,236
    $4,236
    $4,236
    $4,236
    $4,236
    $4,236
    $4,236
    $4,236
    $4,236
    $4,236
    $4,236
    $4,236
    $4,236
    $4,236
    $4,236
    $4,236
    $4,236
    $4,236
    $4,236
    $4,236
    $4,236
    $4,236
    $4,236
    $4,236
    $4,236
    $4,236
    $4,236
    $2,168
    $100
    $100
    Taxable Income Before Depreciation
    $4,064
    $4,361
    $4,667
    $4,980
    $5,303
    $5,635
    $5,976
    $6,326
    $6,687
    $7,058
    $7,440
    $7,833
    $8,238
    $8,655
    $9,084
    $9,526
    $9,982
    $10,451
    $10,935
    $11,434
    $11,948
    $12,478
    $13,025
    $13,590
    $14,173
    $14,774
    $15,395
    $16,036
    $16,698
    $17,382
    Carry Forward Loss From Depreciation
    $172
    $47
    $0
    $0
    $0
    $0
    $0
    $0
    $0
    $0
    $0
    $0
    $0
    $0
    $0
    $0
    $0
    $0
    $0
    $0
    $0
    $0
    $0
    $0
    $0
    $0
    $0
    $0
    $0
    $0
    Taxable Income Offset by Depreciation
    $4,064
    $4,361
    $4,284
    $4,236
    $4,236
    $4,236
    $4,236
    $4,236
    $4,236
    $4,236
    $4,236
    $4,236
    $4,236
    $4,236
    $4,236
    $4,236
    $4,236
    $4,236
    $4,236
    $4,236
    $4,236
    $4,236
    $4,236
    $4,236
    $4,236
    $4,236
    $4,236
    $2,168
    $100
    $100
    Remaining Taxable Income After Depreciation
    $0
    $0
    $383
    $744
    $1,067
    $1,398
    $1,739
    $2,090
    $2,451
    $2,822
    $3,204
    $3,597
    $4,002
    $4,419
    $4,848
    $5,290
    $5,745
    $6,215
    $6,699
    $7,197
    $7,712
    $8,242
    $8,789
    $9,354
    $9,936
    $10,537
    $11,158
    $13,868
    $16,598
    $17,282
    Federal Income Tax Owed on Rental Income
    $0
    $0
    $123
    $238
    $341
    $447
    $557
    $669
    $784
    $903
    $1,025
    $1,151
    $1,281
    $1,414
    $1,551
    $1,693
    $1,839
    $1,989
    $2,144
    $2,303
    $2,468
    $2,637
    $2,813
    $2,993
    $3,180
    $3,372
    $3,571
    $4,438
    $5,311
    $5,530
    Tax Savings from Depreciation
    $1,301
    $1,396
    $1,371
    $1,356
    $1,356
    $1,356
    $1,356
    $1,356
    $1,356
    $1,356
    $1,356
    $1,356
    $1,356
    $1,356
    $1,356
    $1,356
    $1,356
    $1,356
    $1,356
    $1,356
    $1,356
    $1,356
    $1,356
    $1,356
    $1,356
    $1,356
    $1,356
    $694
    $32
    $32
    Cash Flow After Taxes
    $2,648
    $2,872
    $2,979
    $3,097
    $3,232
    $3,369
    $3,508
    $3,649
    $3,792
    $3,936
    $4,082
    $4,230
    $4,380
    $4,532
    $4,685
    $4,840
    $4,996
    $5,155
    $5,314
    $5,476
    $5,638
    $5,802
    $5,968
    $6,134
    $6,302
    $6,471
    $6,641
    $6,150
    $5,660
    $5,832
    Performance Over Time
    Year 1Year 2Year 3Year 4Year 5Year 6Year 7Year 8Year 9Year 10Year 11Year 12Year 13Year 14Year 15Year 16Year 17Year 18Year 19Year 20Year 21Year 22Year 23Year 24Year 25Year 26Year 27Year 28Year 29Year 30
    Fair Market Property Value at Year End
    $124,800
    $129,792
    $134,984
    $140,383
    $145,998
    $151,838
    $157,912
    $164,228
    $170,797
    $177,629
    $184,734
    $192,124
    $199,809
    $207,801
    $216,113
    $224,758
    $233,748
    $243,098
    $252,822
    $262,935
    $273,452
    $284,390
    $295,766
    $307,596
    $319,900
    $332,696
    $346,004
    $359,844
    $374,238
    $389,208
    Cumulative Appreciation
    $4,800
    $9,792
    $14,984
    $20,383
    $25,998
    $31,838
    $37,912
    $44,228
    $50,797
    $57,629
    $64,734
    $72,124
    $79,809
    $87,801
    $96,113
    $104,758
    $113,748
    $123,098
    $132,822
    $142,935
    $153,452
    $164,390
    $175,766
    $187,596
    $199,900
    $212,696
    $226,004
    $239,844
    $254,238
    $269,208
    Cumulative Mortgage Principal Paydown
    $1,416
    $2,905
    $4,470
    $6,115
    $7,844
    $9,662
    $11,573
    $13,581
    $15,692
    $17,912
    $20,244
    $22,696
    $25,274
    $27,983
    $30,831
    $33,825
    $36,972
    $40,280
    $43,757
    $47,412
    $51,254
    $55,293
    $59,538
    $64,001
    $68,691
    $73,622
    $78,805
    $84,253
    $89,980
    $96,000
    Total Cumulative Equity
    $30,216
    $36,697
    $43,454
    $50,498
    $57,843
    $65,500
    $73,485
    $81,810
    $90,490
    $99,541
    $108,979
    $118,820
    $129,083
    $139,785
    $150,945
    $162,583
    $174,720
    $187,378
    $200,579
    $214,347
    $228,706
    $243,683
    $259,304
    $275,597
    $292,592
    $310,318
    $328,809
    $348,098
    $368,218
    $389,208
    Cumulative Cash Flow Before Taxes
    $2,648
    $5,520
    $8,622
    $11,957
    $15,531
    $19,348
    $23,413
    $27,730
    $32,306
    $37,145
    $42,253
    $47,634
    $53,295
    $59,241
    $65,477
    $72,009
    $78,844
    $85,988
    $93,446
    $101,224
    $109,330
    $117,770
    $126,550
    $135,678
    $145,160
    $155,003
    $165,214
    $175,802
    $186,773
    $198,135
    Cumulative Tax Savings From Depreciation
    $1,301
    $2,696
    $4,067
    $5,423
    $6,778
    $8,134
    $9,489
    $10,845
    $12,201
    $13,556
    $14,912
    $16,268
    $17,623
    $18,979
    $20,335
    $21,690
    $23,046
    $24,401
    $25,757
    $27,113
    $28,468
    $29,824
    $31,180
    $32,535
    $33,891
    $35,247
    $36,602
    $37,296
    $37,328
    $37,360
    Cumulative Cash Flow After Taxes
    $2,648
    $5,520
    $8,499
    $11,597
    $14,829
    $18,198
    $21,707
    $25,356
    $29,147
    $33,084
    $37,166
    $41,396
    $45,776
    $50,308
    $54,993
    $59,833
    $64,829
    $69,984
    $75,298
    $80,773
    $86,412
    $92,214
    $98,182
    $104,316
    $110,618
    $117,089
    $123,730
    $129,880
    $135,540
    $141,372
    Total Net Profit if Sold
    -
    $1,834
    $11,154
    $20,864
    $30,992
    $41,552
    $52,558
    $64,027
    $75,973
    $88,414
    $101,366
    $114,847
    $128,874
    $143,468
    $158,648
    $174,435
    $190,849
    $207,914
    $225,651
    $244,086
    $263,242
    $283,146
    $303,824
    $325,305
    $347,618
    $370,792
    $394,859
    $419,190
    $443,819
    $469,443
    Total Return on Investment if Sold
    -
    6.11%
    37.18%
    69.55%
    103.31%
    138.51%
    175.19%
    213.42%
    253.24%
    294.71%
    337.89%
    382.82%
    429.58%
    478.23%
    528.83%
    581.45%
    636.16%
    693.05%
    752.17%
    813.62%
    877.47%
    943.82%
    1012.75%
    1084.35%
    1158.73%
    1235.97%
    1316.2%
    1397.3%
    1479.4%
    1564.81%
    Before-Tax Return on Investment if Held
    29.5%
    31.2%
    32.9%
    34.6%
    36.4%
    38.2%
    40.2%
    42.1%
    44.2%
    46.3%
    48.5%
    50.7%
    53.1%
    55.5%
    58%
    60.6%
    63.2%
    66%
    68.9%
    71.8%
    74.9%
    78.1%
    81.3%
    84.7%
    88.3%
    91.9%
    95.7%
    99.6%
    103.6%
    107.8%
    After-Tax Return on Investment if Held
    29.5%
    31.2%
    32.5%
    33.8%
    35.3%
    36.8%
    38.3%
    39.9%
    41.6%
    43.3%
    45.1%
    46.9%
    48.8%
    50.8%
    52.8%
    54.9%
    57.1%
    59.4%
    61.7%
    64.1%
    66.7%
    69.3%
    72%
    74.8%
    77.7%
    80.7%
    83.8%
    84.8%
    85.9%
    89.4%
    Internal Rate of Return (IRR)
    -
    3.1%
    12.1%
    15.9%
    17.7%
    18.5%
    18.9%
    19%
    18.9%
    18.8%
    18.7%
    18.5%
    18.3%
    18.1%
    17.9%
    17.7%
    17.5%
    17.4%
    17.2%
    17%
    16.9%
    16.8%
    16.6%
    16.5%
    16.4%
    16.3%
    16.2%
    16.1%
    16%
    15.9%