Own Cash-Flowing Rental Properties in the Best U.S. Markets From Anywhere!

Search
Close this search box.

Welcome to Akron!

ABOUT Akron

This is your opportunity to own turnkey rental properties in America’s most recession resilient housing market. Akron, Ohio was was ranked the #1 most recession-resilient housing market in the U.S. by Redfin. Its low home-price volatility and low debt-to-income ratio were central reasons why Redfin declared Akron as having the lowest chance of a housing downturn if the U.S. enters a recession. The Akron MSA is part of the Cleveland-Canton-Akron combined statistical area, which has over 3.5 million people. Akron is the hometown of the NBA’s all time leading scorer, Lebron James, and it is known as “The Rubber City” because it was the historical center of the U.S. tire and rubber industry. Today, Arkon is home to Fortune 500 companies like Goodyear Tires and First Energy Corp. Bridgestone just unveiled a new Akron race tire production center and Amazon just unveiled a new Akron fulfillment center, so it has a stable workforce and a large pool of qualified tenants.

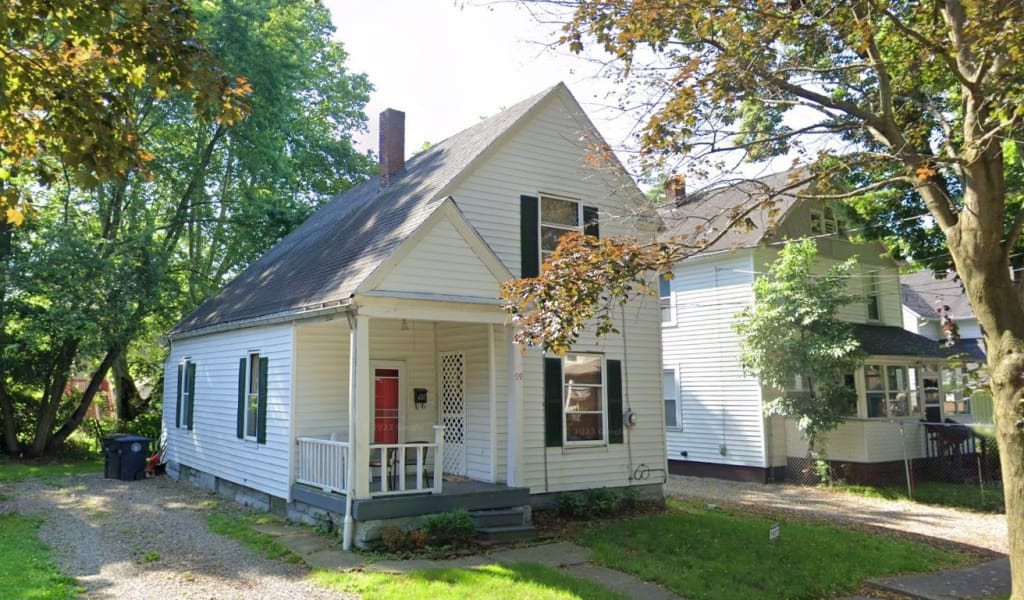
Westwood Avenue Akron, Ohio

RESERVE THIS PROPERTY

OFFERED BY THE SELLER

  • 1 Year 3rd Party Home Warranty Provided by Seller
  • 1 Year Free property management if you use the sellers preferred Property Management company.

Snapshot Financials

Price:
$ 145000
Rent:
$ 1245 / mo
Taxes:

Estimated Property Taxes

$ 108.417
Insurance:

Estimated Insurance

$ 56.25
HOA Fee:

Home Owners Association Fee

$ 0
PM Fee:

Property Management Fee

$ 100
0:
$ 0
0:
$ 0
Vacancy:

Based on 7%

$ 87.15
Repairs:

Based on 5%

$ 62.25
Total:

Total Monthly Expenses

$ 414.067
NOI:

Monthly Net Operating Income ('NOI') = Monthly Gross Scheduled Rent - Monthly Operating Expenses - 5% Maintenance Estimate - 7% Vacancy Estimates. NOI does not take into account any financing that you may be using. The NOI is always an 'estimate' and can never be guaranteed because it includes the non-fixed variables of 'maintenance' and 'vacancy' which vary over time.

$ 831 / mo
Cap Rate:

Capitalization Rate ('Cap Rate') = Annual Net Operating Income / Purchase Price. Cap Rate does not take into account any financing you may be using nor any closing costs you may be paying.

6.88 %
GRM:

Gross Rent Multiplier ('GRM') = Purchase Price / Annual Gross Scheduled Rent. GRM is only a price to rent ratio and does not take into account any operating expenses, financing, closing cost payments or maintenance and vacancy assumptions. And remember, GRM is like a golf score, the lower the better.

9.71

Property Features

Type:
Single Family Home
Condition:
Fully Renovated as Condition of Closing
Rental Status:
Tenant in Place as Condition of Closing
Year Built:
1893
Bedrooms:
4
Bathrooms:
1.5
Floor Area:
1294 Sq Ft
Lot Size:
4,730 Sq Ft
Stories:
2 Stories
Basement:
Unfinished
Parking:
Off-Street Parking
RESERVE THIS PROPERTY

Akron Highlights

Akron Properties:

  • Fully Renovated Single Family Homes
  • Tenants and Local Property Management in Place at Closing
  • 140K Average Purchase Price
  • 6.5% Average Cap Rate

Akron Market:

  • #1 Most Recession-Resilient Market in the U.S. (Source: Redfin)
  • Hometown of NBA all time leading scorer, Lebron James
  • Known as “The Rubber City” and Home to Fortune 500 Company GoodYear Tires
  • 3.5 Million People in the Cleveland-Canton-Akron Combined Statistical Area (Source: U.S. Census)
  • Lower than Average Cost of Living

Similar
Properties

Maverick Property Vault

$764 Net Operating Income
$823 Net Operating Income

More Maverick Markets

Subscribe

    GET Access TO Private buying opportunities for TURNKEY Rental properies & EDUCATIONAL RESOURCES. READ OUR PRIVACY NOTICE & TERMS OF USE.

    Maverick's Cash-Flow Calculator

    DISCLAIMER
    OPEN

    This calculator is for recreational use only and is NOT financial or accounting software. There are a litany of variables that may be relevant to determining your individual tax obligations, financial performance and investment returns on a rental property that are NOT factored into this calculator. By using this calculator, you understand that the numbers herein are NOT specific projections of what your returns will actually be, and you agree that it is YOUR DUTY to consult with your own tax and financial professionals about the evaluation, risk assessment, realistic financial expectations, and actual tax obligations associated with any real estate investment. You also understand that ALL real estate investing involves risk, which buyer assumes 100%, and that no specific returns can ever be guaranteed by anyone.

    Top

    INSTRUCTIONS

    Click into any Investor INPUTS (THE ORANGE FIELDS) to modify.
    Click any field LABEL to view a definition.
    Click CALCULATE to update financial calculations on ALL TABS.
    Purchase
    Monthly Cashflow
    Tax Benefits
    Future Assumptions

    INSTRUCTIONS

    Click into any Investor INPUTS (THE ORANGE FIELDS) to modify.
    Click any field LABEL to view a definition.
    Click CALCULATE to update financial calculations on ALL TABS.
    Cash to Purchase
    Purchase Price
    $145,000
    Fair Market Value
    $145,000
    Down Payment Amount
    $29,000
    Depreciable Closing Costs
    $3,000
    Lender Fees / Points
    $3,000
    Total Cash Invested
    $35,000
    Total Equity at Purchase
    $29,000
    Morgage Calculation
    Loan Amount
    $116,000
    Monthly Mortgage Payment
    $623
    First Year Mortgage Principal Paid Down
    $1,711
    First Year Mortgage Interest Paid
    $5,761

    INSTRUCTIONS

    Click into any Investor INPUTS (THE ORANGE FIELDS) to modify.
    Click any field LABEL to view a definition.
    Click CALCULATE to update financial calculations on ALL TABS.
    First Year Monthly Cashflow
    Gross Scheduled Rent
    $1,245
    Vacancy Estimate
    $87
    Gross Operating Income
    $1,158
    Property Taxes
    $108
    Insurance
    $56
    Other Expense
    $0
    Owner-Paid Utilities / Landscaping
    $0
    Property Management Fee
    $125
    Maintenance Estimate
    $62
    Total Operating Expenses
    $351
    Net Operating Income (NOI)
    $807
    Mortgage Payment
    $623
    Cash Flow Before Taxes
    $184
    Gross Rent Multiplier (GRM)
    9.7
    Rent to Value Ratio (RV Ratio)
    0.9%
    Capitalization Rate (Cap Rate)
    6.7%
    Cash on Cash Return
    6.3%

    INSTRUCTIONS

    Click into any Investor INPUTS (THE ORANGE FIELDS) to modify.
    Click any field LABEL to view a definition.
    Click CALCULATE to update financial calculations on ALL TABS.
    Tax Benefits
    Value of (Non-Depreciable) Land
    $14,500
    Value of (Depreciable) Property Structure
    $130,500
    Depreciable "Cost Basis" at Purchase
    $133,500
    Annual Straight Line Depreciation of Cost Basis
    $4,855
    Annual Depreciation of Lender Fees / Costs
    $100
    First Year Total Depreciation
    $4,955
    First Year Taxable Income Before Depreciation
    $3,924
    First Year Taxable Income Offset by Depreciation
    $3,924
    First Year Remaining Taxable Income After Depreciation
    $0
    First Year Federal Income Taxes Owed on Rental Income
    $0
    First Year Tax Savings from Depreciation on Rental Income
    $1,256
    First Year Left Over Depreciation
    $1,030

    INSTRUCTIONS

    Click into any Investor INPUTS (THE ORANGE FIELDS) to modify.
    Click any field LABEL to view a definition.
    Click CALCULATE to update financial calculations on ALL TABS.
    (Swipe left or right to scroll horizontally)
    Annual Income
    Year 1Year 2Year 3Year 4Year 5Year 6Year 7Year 8Year 9Year 10Year 11Year 12Year 13Year 14Year 15Year 16Year 17Year 18Year 19Year 20Year 21Year 22Year 23Year 24Year 25Year 26Year 27Year 28Year 29Year 30
    Gross Scheduled Rent
    $14,940
    $15,239
    $15,544
    $15,854
    $16,172
    $16,495
    $16,825
    $17,161
    $17,505
    $17,855
    $18,212
    $18,576
    $18,948
    $19,326
    $19,713
    $20,107
    $20,509
    $20,920
    $21,338
    $21,765
    $22,200
    $22,644
    $23,097
    $23,559
    $24,030
    $24,511
    $25,001
    $25,501
    $26,011
    $26,531
    Vacancy Loss
    $1,046
    $1,067
    $1,088
    $1,110
    $1,132
    $1,155
    $1,178
    $1,201
    $1,225
    $1,250
    $1,275
    $1,300
    $1,326
    $1,353
    $1,380
    $1,408
    $1,436
    $1,464
    $1,494
    $1,524
    $1,554
    $1,585
    $1,617
    $1,649
    $1,682
    $1,716
    $1,750
    $1,785
    $1,821
    $1,857
    Gross Operating Income
    $13,894
    $14,172
    $14,456
    $14,745
    $15,040
    $15,340
    $15,647
    $15,960
    $16,279
    $16,605
    $16,937
    $17,276
    $17,621
    $17,974
    $18,333
    $18,700
    $19,074
    $19,455
    $19,844
    $20,241
    $20,646
    $21,059
    $21,480
    $21,910
    $22,348
    $22,795
    $23,251
    $23,716
    $24,190
    $24,674
    Annual Operating Expenses
    Year 1Year 2Year 3Year 4Year 5Year 6Year 7Year 8Year 9Year 10Year 11Year 12Year 13Year 14Year 15Year 16Year 17Year 18Year 19Year 20Year 21Year 22Year 23Year 24Year 25Year 26Year 27Year 28Year 29Year 30
    Property Taxes
    $1,296
    $1,296
    $1,296
    $1,296
    $1,296
    $1,296
    $1,296
    $1,296
    $1,296
    $1,296
    $1,296
    $1,296
    $1,296
    $1,296
    $1,296
    $1,296
    $1,296
    $1,296
    $1,296
    $1,296
    $1,296
    $1,296
    $1,296
    $1,296
    $1,296
    $1,296
    $1,296
    $1,296
    $1,296
    $1,296
    Insurance
    $672
    $672
    $672
    $672
    $672
    $672
    $672
    $672
    $672
    $672
    $672
    $672
    $672
    $672
    $672
    $672
    $672
    $672
    $672
    $672
    $672
    $672
    $672
    $672
    $672
    $672
    $672
    $672
    $672
    $672
    Maintenance Assumption
    $747
    $762
    $777
    $793
    $809
    $825
    $841
    $858
    $875
    $893
    $911
    $929
    $947
    $966
    $986
    $1,005
    $1,025
    $1,046
    $1,067
    $1,088
    $1,110
    $1,132
    $1,155
    $1,178
    $1,202
    $1,226
    $1,250
    $1,275
    $1,301
    $1,327
    Property Management
    $1,494
    $1,524
    $1,554
    $1,585
    $1,617
    $1,649
    $1,682
    $1,716
    $1,750
    $1,785
    $1,821
    $1,858
    $1,895
    $1,933
    $1,971
    $2,011
    $2,051
    $2,092
    $2,134
    $2,176
    $2,220
    $2,264
    $2,310
    $2,356
    $2,403
    $2,451
    $2,500
    $2,550
    $2,601
    $2,653
    Owner-Paid Utilities / Landscaping
    $0
    $0
    $0
    $0
    $0
    $0
    $0
    $0
    $0
    $0
    $0
    $0
    $0
    $0
    $0
    $0
    $0
    $0
    $0
    $0
    $0
    $0
    $0
    $0
    $0
    $0
    $0
    $0
    $0
    $0
    Other Expense
    $0
    $0
    $0
    $0
    $0
    $0
    $0
    $0
    $0
    $0
    $0
    $0
    $0
    $0
    $0
    $0
    $0
    $0
    $0
    $0
    $0
    $0
    $0
    $0
    $0
    $0
    $0
    $0
    $0
    $0
    Total Operating Expenses
    $4,209
    $4,254
    $4,300
    $4,346
    $4,394
    $4,442
    $4,492
    $4,542
    $4,594
    $4,646
    $4,700
    $4,754
    $4,810
    $4,867
    $4,925
    $4,984
    $5,044
    $5,106
    $5,169
    $5,233
    $5,298
    $5,365
    $5,433
    $5,502
    $5,573
    $5,645
    $5,718
    $5,793
    $5,870
    $5,948
    Annual Debt Service
    Year 1Year 2Year 3Year 4Year 5Year 6Year 7Year 8Year 9Year 10Year 11Year 12Year 13Year 14Year 15Year 16Year 17Year 18Year 19Year 20Year 21Year 22Year 23Year 24Year 25Year 26Year 27Year 28Year 29Year 30
    Debt Service
    $7,473
    $7,473
    $7,473
    $7,473
    $7,473
    $7,473
    $7,473
    $7,473
    $7,473
    $7,473
    $7,473
    $7,473
    $7,473
    $7,473
    $7,473
    $7,473
    $7,473
    $7,473
    $7,473
    $7,473
    $7,473
    $7,473
    $7,473
    $7,473
    $7,473
    $7,473
    $7,473
    $7,473
    $7,473
    $7,473
    Mortgage Balance at Year End
    $114,289
    $112,490
    $110,599
    $108,611
    $106,521
    $104,325
    $102,016
    $99,589
    $97,038
    $94,357
    $91,538
    $88,575
    $85,461
    $82,187
    $78,745
    $75,128
    $71,325
    $67,328
    $63,127
    $58,710
    $54,068
    $49,188
    $44,058
    $38,666
    $32,998
    $27,040
    $20,777
    $14,194
    $7,274
    -
    Debt Service Coverage Ratio
    1.3%
    1.33%
    1.36%
    1.39%
    1.42%
    1.46%
    1.49%
    1.53%
    1.56%
    1.6%
    1.64%
    1.68%
    1.71%
    1.75%
    1.79%
    1.84%
    1.88%
    1.92%
    1.96%
    2.01%
    2.05%
    2.1%
    2.15%
    2.2%
    2.24%
    2.3%
    2.35%
    2.4%
    2.45%
    2.51%
    Annual Capital Improvements
    Year 1Year 2Year 3Year 4Year 5Year 6Year 7Year 8Year 9Year 10Year 11Year 12Year 13Year 14Year 15Year 16Year 17Year 18Year 19Year 20Year 21Year 22Year 23Year 24Year 25Year 26Year 27Year 28Year 29Year 30
    Capital Improvements
    $0
    $0
    $0
    $0
    $0
    $0
    $0
    $0
    $0
    $0
    $0
    $0
    $0
    $0
    $0
    $0
    $0
    $0
    $0
    $0
    $0
    $0
    $0
    $0
    $0
    $0
    $0
    $0
    $0
    $0
    Annual Cash Flow Analysis
    Year 1Year 2Year 3Year 4Year 5Year 6Year 7Year 8Year 9Year 10Year 11Year 12Year 13Year 14Year 15Year 16Year 17Year 18Year 19Year 20Year 21Year 22Year 23Year 24Year 25Year 26Year 27Year 28Year 29Year 30
    Net Operating Income
    $9,685
    $9,918
    $10,156
    $10,398
    $10,646
    $10,898
    $11,155
    $11,418
    $11,686
    $11,959
    $12,237
    $12,521
    $12,811
    $13,107
    $13,408
    $13,716
    $14,029
    $14,349
    $14,676
    $15,009
    $15,348
    $15,694
    $16,048
    $16,408
    $16,775
    $17,150
    $17,533
    $17,923
    $18,321
    $18,726
    Capitalization Rate
    6.7%
    6.8%
    7%
    7.2%
    7.3%
    7.5%
    7.7%
    7.9%
    8.1%
    8.2%
    8.4%
    8.6%
    8.8%
    9%
    9.2%
    9.5%
    9.7%
    9.9%
    10.1%
    10.4%
    10.6%
    10.8%
    11.1%
    11.3%
    11.6%
    11.8%
    12.1%
    12.4%
    12.6%
    12.9%
    Cash Flow Before Taxes
    $2,213
    $2,446
    $2,683
    $2,926
    $3,173
    $3,426
    $3,683
    $3,945
    $4,213
    $4,486
    $4,765
    $5,049
    $5,339
    $5,634
    $5,936
    $6,243
    $6,557
    $6,877
    $7,203
    $7,536
    $7,875
    $8,222
    $8,575
    $8,935
    $9,303
    $9,678
    $10,060
    $10,450
    $10,848
    $11,254
    Cash on Cash Return
    6.3%
    7%
    7.7%
    8.4%
    9.1%
    9.8%
    10.5%
    11.3%
    12%
    12.8%
    13.6%
    14.4%
    15.3%
    16.1%
    17%
    17.8%
    18.7%
    19.6%
    20.6%
    21.5%
    22.5%
    23.5%
    24.5%
    25.5%
    26.6%
    27.7%
    28.7%
    29.9%
    31%
    32.2%
    Annual Equity Accumulation
    Year 1Year 2Year 3Year 4Year 5Year 6Year 7Year 8Year 9Year 10Year 11Year 12Year 13Year 14Year 15Year 16Year 17Year 18Year 19Year 20Year 21Year 22Year 23Year 24Year 25Year 26Year 27Year 28Year 29Year 30
    Property Appreciation
    $5,800
    $6,032
    $6,273
    $6,524
    $6,785
    $7,057
    $7,339
    $7,632
    $7,938
    $8,255
    $8,585
    $8,929
    $9,286
    $9,657
    $10,044
    $10,445
    $10,863
    $11,298
    $11,750
    $12,220
    $12,709
    $13,217
    $13,746
    $14,295
    $14,867
    $15,462
    $16,080
    $16,724
    $17,392
    $18,088
    Mortgage Principal Pay Down
    $1,711
    $1,799
    $1,891
    $1,988
    $2,089
    $2,196
    $2,309
    $2,427
    $2,551
    $2,682
    $2,819
    $2,963
    $3,115
    $3,274
    $3,441
    $3,617
    $3,803
    $3,997
    $4,202
    $4,417
    $4,642
    $4,880
    $5,130
    $5,392
    $5,668
    $5,958
    $6,263
    $6,583
    $6,920
    $7,274
    Total Equity Growth
    $7,511
    $7,831
    $8,164
    $8,512
    $8,875
    $9,253
    $9,648
    $10,059
    $10,489
    $10,937
    $11,404
    $11,892
    $12,401
    $12,931
    $13,485
    $14,063
    $14,666
    $15,295
    $15,951
    $16,636
    $17,351
    $18,097
    $18,875
    $19,687
    $20,535
    $21,420
    $22,343
    $23,307
    $24,312
    $25,362
    Annual Tax Savings From Depreciation
    Year 1Year 2Year 3Year 4Year 5Year 6Year 7Year 8Year 9Year 10Year 11Year 12Year 13Year 14Year 15Year 16Year 17Year 18Year 19Year 20Year 21Year 22Year 23Year 24Year 25Year 26Year 27Year 28Year 29Year 30
    Straight Line Depreciation of Cost Basis
    $4,955
    $4,955
    $4,955
    $4,955
    $4,955
    $4,955
    $4,955
    $4,955
    $4,955
    $4,955
    $4,955
    $4,955
    $4,955
    $4,955
    $4,955
    $4,955
    $4,955
    $4,955
    $4,955
    $4,955
    $4,955
    $4,955
    $4,955
    $4,955
    $4,955
    $4,955
    $4,955
    $2,477
    $0
    $0
    Straight Line Depreciaiton of Lender Fees / Points
    $100
    $100
    $100
    $100
    $100
    $100
    $100
    $100
    $100
    $100
    $100
    $100
    $100
    $100
    $100
    $100
    $100
    $100
    $100
    $100
    $100
    $100
    $100
    $100
    $100
    $100
    $100
    $100
    $100
    $100
    Total Straight Line Depreciation
    $5,055
    $5,055
    $5,055
    $5,055
    $5,055
    $5,055
    $5,055
    $5,055
    $5,055
    $5,055
    $5,055
    $5,055
    $5,055
    $5,055
    $5,055
    $5,055
    $5,055
    $5,055
    $5,055
    $5,055
    $5,055
    $5,055
    $5,055
    $5,055
    $5,055
    $5,055
    $5,055
    $2,577
    $100
    $100
    Taxable Income Before Depreciation
    $3,924
    $4,245
    $4,574
    $4,914
    $5,263
    $5,622
    $5,992
    $6,372
    $6,764
    $7,168
    $7,583
    $8,012
    $8,453
    $8,908
    $9,377
    $9,861
    $10,359
    $10,874
    $11,405
    $11,952
    $12,518
    $13,102
    $13,705
    $14,327
    $14,971
    $15,636
    $16,323
    $17,033
    $17,768
    $18,528
    Carry Forward Loss From Depreciation
    $1,130
    $1,940
    $2,420
    $2,561
    $2,353
    $1,786
    $849
    $0
    $0
    $0
    $0
    $0
    $0
    $0
    $0
    $0
    $0
    $0
    $0
    $0
    $0
    $0
    $0
    $0
    $0
    $0
    $0
    $0
    $0
    $0
    Taxable Income Offset by Depreciation
    $3,924
    $4,245
    $4,574
    $4,914
    $5,263
    $5,622
    $5,992
    $5,903
    $5,055
    $5,055
    $5,055
    $5,055
    $5,055
    $5,055
    $5,055
    $5,055
    $5,055
    $5,055
    $5,055
    $5,055
    $5,055
    $5,055
    $5,055
    $5,055
    $5,055
    $5,055
    $5,055
    $2,577
    $100
    $100
    Remaining Taxable Income After Depreciation
    $0
    $0
    $0
    $0
    $0
    $0
    $0
    $469
    $1,710
    $2,113
    $2,529
    $2,957
    $3,399
    $3,853
    $4,322
    $4,806
    $5,305
    $5,819
    $6,350
    $6,898
    $7,463
    $8,047
    $8,650
    $9,273
    $9,916
    $10,581
    $11,268
    $14,456
    $17,668
    $18,428
    Federal Income Tax Owed on Rental Income
    $0
    $0
    $0
    $0
    $0
    $0
    $0
    $150
    $547
    $676
    $809
    $946
    $1,088
    $1,233
    $1,383
    $1,538
    $1,698
    $1,862
    $2,032
    $2,207
    $2,388
    $2,575
    $2,768
    $2,967
    $3,173
    $3,386
    $3,606
    $4,626
    $5,654
    $5,897
    Tax Savings from Depreciation
    $1,256
    $1,358
    $1,464
    $1,572
    $1,684
    $1,799
    $1,917
    $1,889
    $1,617
    $1,617
    $1,617
    $1,617
    $1,617
    $1,617
    $1,617
    $1,617
    $1,617
    $1,617
    $1,617
    $1,617
    $1,617
    $1,617
    $1,617
    $1,617
    $1,617
    $1,617
    $1,617
    $825
    $32
    $32
    Cash Flow After Taxes
    $2,213
    $2,446
    $2,683
    $2,926
    $3,173
    $3,426
    $3,683
    $3,795
    $3,666
    $3,810
    $3,955
    $4,102
    $4,251
    $4,401
    $4,552
    $4,705
    $4,859
    $5,015
    $5,171
    $5,329
    $5,487
    $5,647
    $5,807
    $5,968
    $6,130
    $6,292
    $6,454
    $5,824
    $5,194
    $5,357
    Performance Over Time
    Year 1Year 2Year 3Year 4Year 5Year 6Year 7Year 8Year 9Year 10Year 11Year 12Year 13Year 14Year 15Year 16Year 17Year 18Year 19Year 20Year 21Year 22Year 23Year 24Year 25Year 26Year 27Year 28Year 29Year 30
    Fair Market Property Value at Year End
    $150,800
    $156,832
    $163,105
    $169,629
    $176,415
    $183,471
    $190,810
    $198,443
    $206,380
    $214,635
    $223,221
    $232,150
    $241,436
    $251,093
    $261,137
    $271,582
    $282,446
    $293,743
    $305,493
    $317,713
    $330,421
    $343,638
    $357,384
    $371,679
    $386,546
    $402,008
    $418,088
    $434,812
    $452,204
    $470,293
    Cumulative Appreciation
    $5,800
    $11,832
    $18,105
    $24,629
    $31,415
    $38,471
    $45,810
    $53,443
    $61,380
    $69,635
    $78,221
    $87,150
    $96,436
    $106,093
    $116,137
    $126,582
    $137,446
    $148,743
    $160,493
    $172,713
    $185,421
    $198,638
    $212,384
    $226,679
    $241,546
    $257,008
    $273,088
    $289,812
    $307,204
    $325,293
    Cumulative Mortgage Principal Paydown
    $1,711
    $3,510
    $5,401
    $7,389
    $9,479
    $11,675
    $13,984
    $16,411
    $18,962
    $21,643
    $24,462
    $27,425
    $30,539
    $33,813
    $37,255
    $40,872
    $44,675
    $48,672
    $52,873
    $57,290
    $61,932
    $66,812
    $71,942
    $77,334
    $83,002
    $88,960
    $95,223
    $101,806
    $108,726
    $116,000
    Total Cumulative Equity
    $36,511
    $44,342
    $52,507
    $61,019
    $69,893
    $79,146
    $88,794
    $98,853
    $109,342
    $120,279
    $131,683
    $143,575
    $155,975
    $168,906
    $182,391
    $196,454
    $211,120
    $226,415
    $242,366
    $259,003
    $276,354
    $294,450
    $313,326
    $333,013
    $353,548
    $374,968
    $397,311
    $420,618
    $444,930
    $470,293
    Cumulative Cash Flow Before Taxes
    $2,213
    $4,658
    $7,342
    $10,268
    $13,441
    $16,866
    $20,549
    $24,495
    $28,708
    $33,194
    $37,958
    $43,007
    $48,346
    $53,980
    $59,915
    $66,158
    $72,715
    $79,592
    $86,795
    $94,331
    $102,206
    $110,428
    $119,003
    $127,939
    $137,242
    $146,919
    $156,979
    $167,430
    $178,278
    $189,531
    Cumulative Tax Savings From Depreciation
    $1,256
    $2,614
    $4,078
    $5,650
    $7,334
    $9,133
    $11,051
    $12,940
    $14,557
    $16,175
    $17,792
    $19,409
    $21,027
    $22,644
    $24,262
    $25,879
    $27,497
    $29,114
    $30,732
    $32,349
    $33,967
    $35,584
    $37,201
    $38,819
    $40,436
    $42,054
    $43,671
    $44,496
    $44,528
    $44,560
    Cumulative Cash Flow After Taxes
    $2,213
    $4,658
    $7,342
    $10,268
    $13,441
    $16,866
    $20,549
    $24,345
    $28,011
    $31,820
    $35,776
    $39,878
    $44,129
    $48,530
    $53,083
    $57,788
    $62,647
    $67,662
    $72,833
    $78,161
    $83,649
    $89,295
    $95,102
    $101,070
    $107,200
    $113,492
    $119,946
    $125,770
    $130,964
    $136,321
    Total Net Profit if Sold
    -
    $1,454
    $11,800
    $22,716
    $34,221
    $46,335
    $59,078
    $72,322
    $85,842
    $99,928
    $114,601
    $129,881
    $145,790
    $162,349
    $179,583
    $197,516
    $216,172
    $235,577
    $255,760
    $276,747
    $298,569
    $321,255
    $344,837
    $369,349
    $394,825
    $421,299
    $448,810
    $476,603
    $504,718
    $533,990
    Total Return on Investment if Sold
    -
    4.15%
    33.71%
    64.9%
    97.77%
    132.39%
    168.8%
    206.64%
    245.26%
    285.51%
    327.43%
    371.09%
    416.54%
    463.85%
    513.1%
    564.33%
    617.63%
    673.08%
    730.74%
    790.71%
    853.05%
    917.87%
    985.25%
    1055.28%
    1128.07%
    1203.71%
    1282.31%
    1361.72%
    1442.05%
    1525.69%
    Before-Tax Return on Investment if Held
    27.8%
    29.4%
    31%
    32.7%
    34.4%
    36.2%
    38.1%
    40%
    42%
    44.1%
    46.2%
    48.4%
    50.7%
    53%
    55.5%
    58%
    60.6%
    63.3%
    66.2%
    69.1%
    72.1%
    75.2%
    78.4%
    81.8%
    85.3%
    88.9%
    92.6%
    96.4%
    100.5%
    104.6%
    After-Tax Return on Investment if Held
    27.8%
    29.4%
    31%
    32.7%
    34.4%
    36.2%
    38.1%
    39.6%
    40.4%
    42.1%
    43.9%
    45.7%
    47.6%
    49.5%
    51.5%
    53.6%
    55.8%
    58%
    60.3%
    62.8%
    65.3%
    67.8%
    70.5%
    73.3%
    76.2%
    79.2%
    82.3%
    83.2%
    84.3%
    87.8%
    Internal Rate of Return (IRR)
    -
    2.1%
    10.8%
    14.4%
    16.1%
    16.9%
    17.2%
    17.3%
    17.3%
    17.2%
    17%
    16.9%
    16.7%
    16.5%
    16.3%
    16.1%
    15.9%
    15.8%
    15.6%
    15.4%
    15.3%
    15.1%
    15%
    14.9%
    14.7%
    14.6%
    14.5%
    14.4%
    14.3%
    14.2%