Own Cash-Flowing Rental Properties in the Best U.S. Markets From Anywhere!

Search
Close this search box.

Welcome to Philadelphia!

ABOUT Philadelphia

With the 4th largest GDP of any city in the U.S. and the 9th largest GDP of any city in the WORLD, Philadelphia is a powerhouse market for real estate investors. Philly has over 92 colleges and Universities, gets over 4 Million Tourist Visitors a Year, and is one of the nation’s premiere sports towns–home to the Super Bowl Champion Philadelphia Eagles!  Philly is also home to 12 Fortune 500 Companies and the city continues to grow as a $225 Million Project was announced for a planned Waterfront Park expected to spur $1.6 Billion in private economic activity & lead to 2,400 new permanent jobs by 2022! (Source: Philly.com).   Last year, Philadelphia home prices Increased at nearly twice the rate of the other 10 largest U.S. cities and continue to trend upward.  This is a market on the move and now is your opportunity to buy in the path of growth.

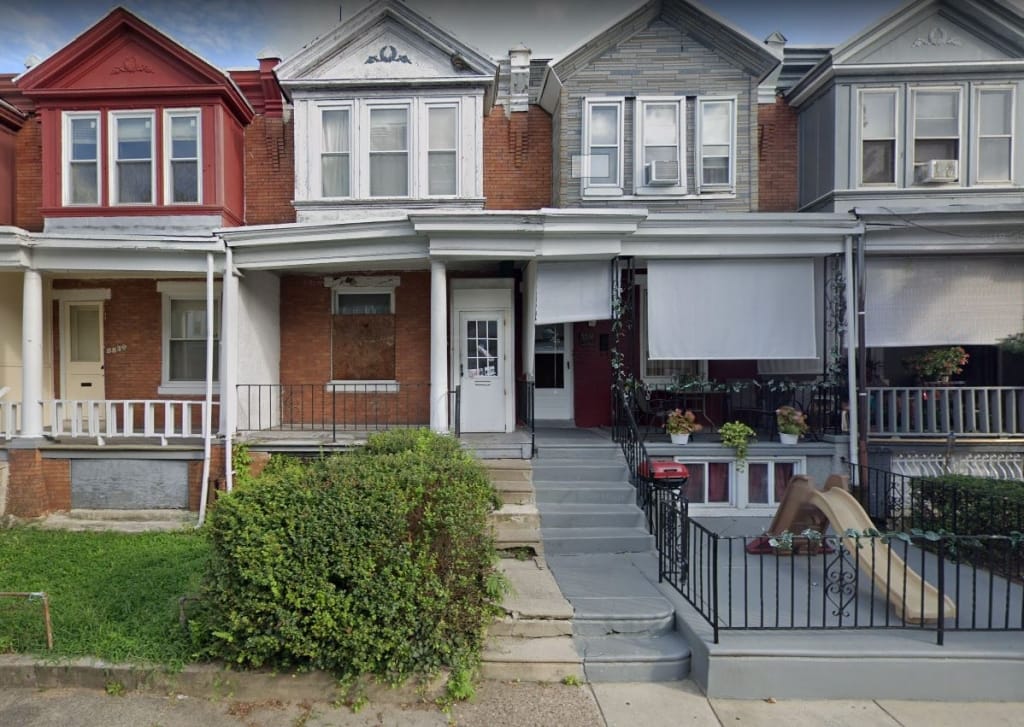
Upland Street Philadelphia, PA

RESERVE THIS PROPERTY

OFFERED BY THE SELLER

  • 3rd Party Home Warranty Provided by Seller at Closing.

Snapshot Financials

Price:
$ 155000
Rent:
$ 1400 / mo
Taxes:

Estimated Property Taxes

$ 22.5133
Insurance:

Estimated Insurance

$ 795
HOA Fee:

Home Owners Association Fee

$ 0
PM Fee:

Property Management Fee

$ 140
Rental license Inspect:
$ 6
Other:
$ 0
Vacancy:

Based on 7%

$ 98
Repairs:

Based on 5%

$ 70
Total:

Total Monthly Expenses

$ 402.763
NOI:

Monthly Net Operating Income ('NOI') = Monthly Gross Scheduled Rent - Monthly Operating Expenses - 5% Maintenance Estimate - 7% Vacancy Estimates. NOI does not take into account any financing that you may be using. The NOI is always an 'estimate' and can never be guaranteed because it includes the non-fixed variables of 'maintenance' and 'vacancy' which vary over time.

$ 997 / mo
Cap Rate:

Capitalization Rate ('Cap Rate') = Annual Net Operating Income / Purchase Price. Cap Rate does not take into account any financing you may be using nor any closing costs you may be paying.

7.72 %
GRM:

Gross Rent Multiplier ('GRM') = Purchase Price / Annual Gross Scheduled Rent. GRM is only a price to rent ratio and does not take into account any operating expenses, financing, closing cost payments or maintenance and vacancy assumptions. And remember, GRM is like a golf score, the lower the better.
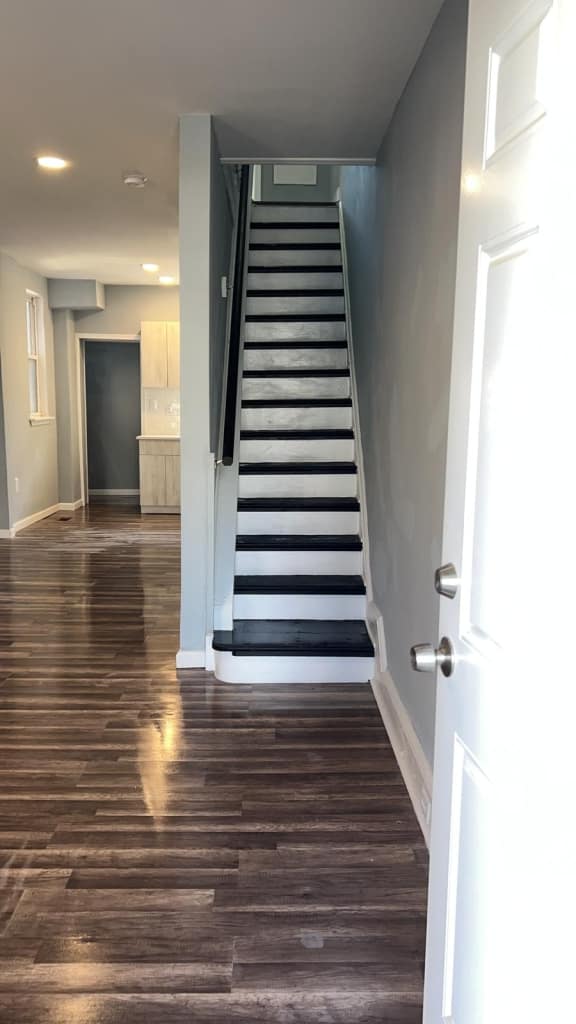
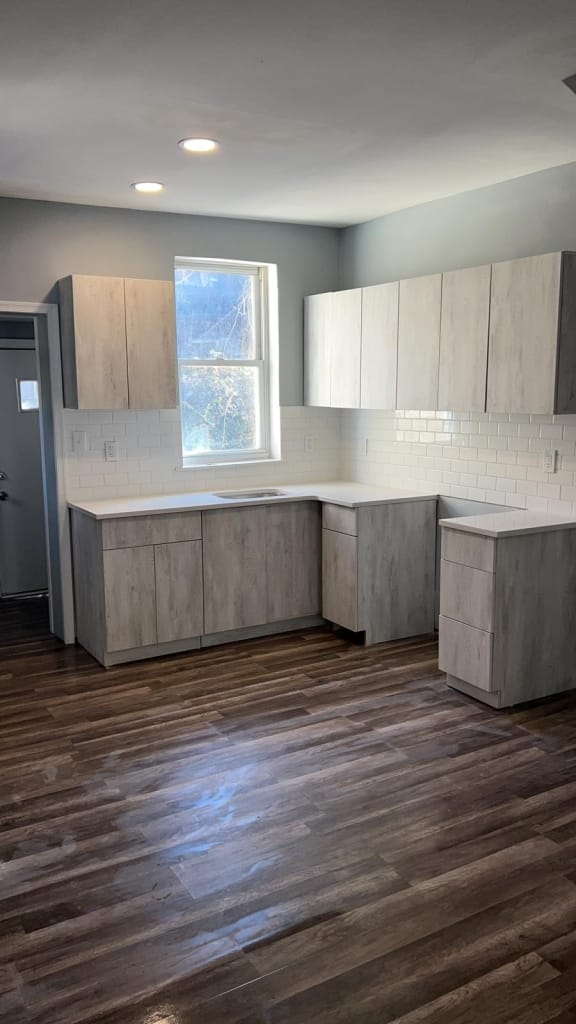
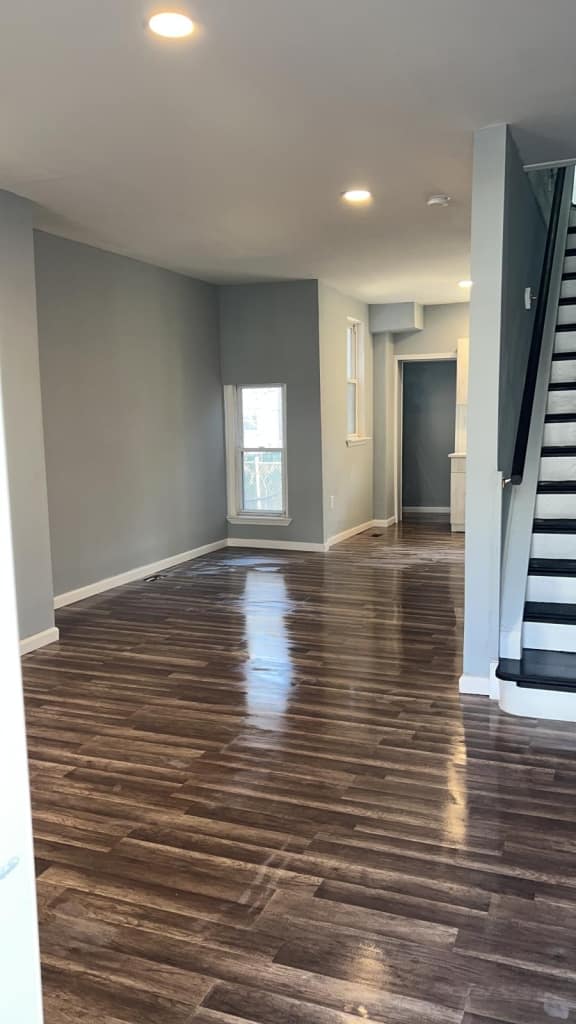
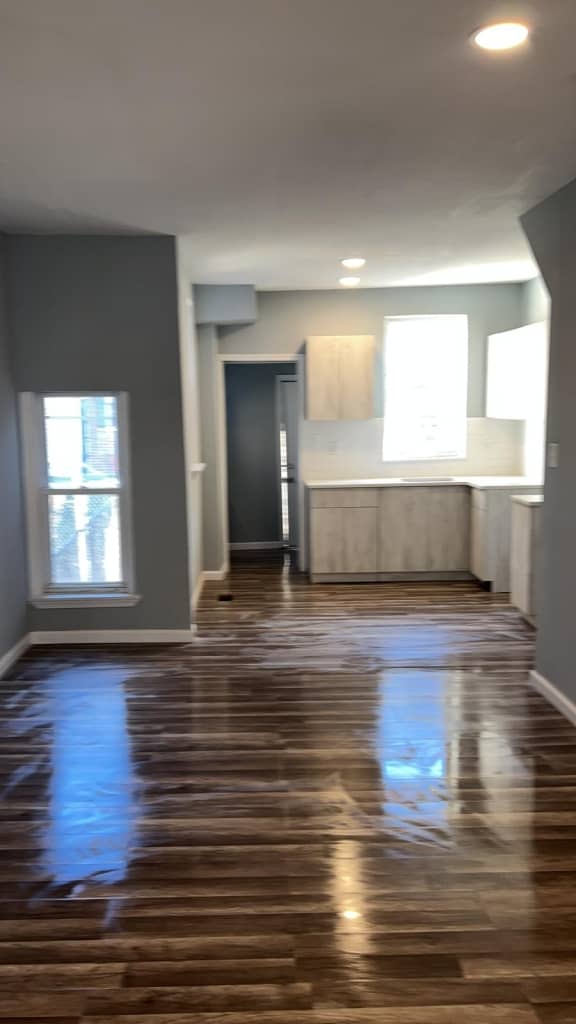
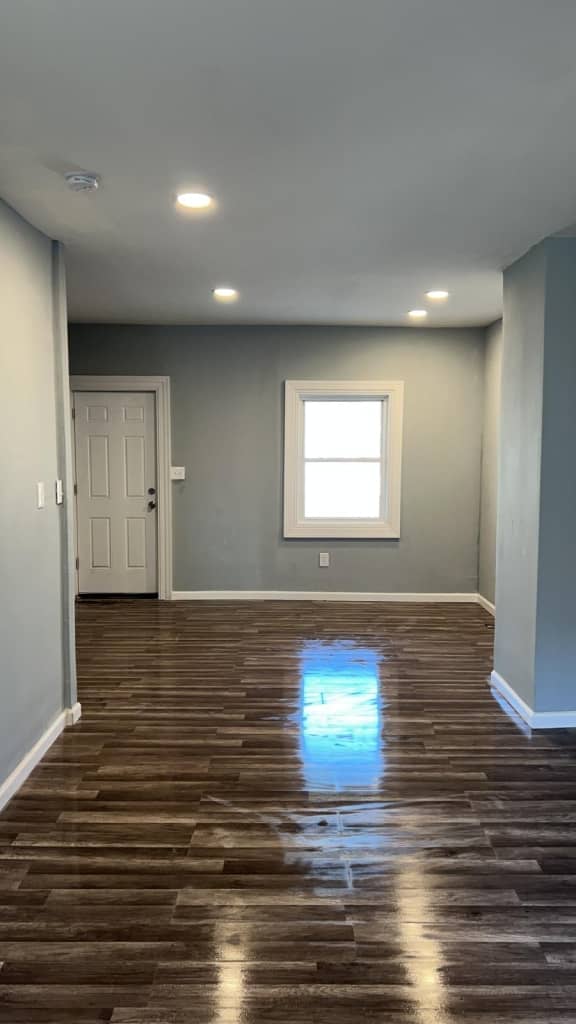
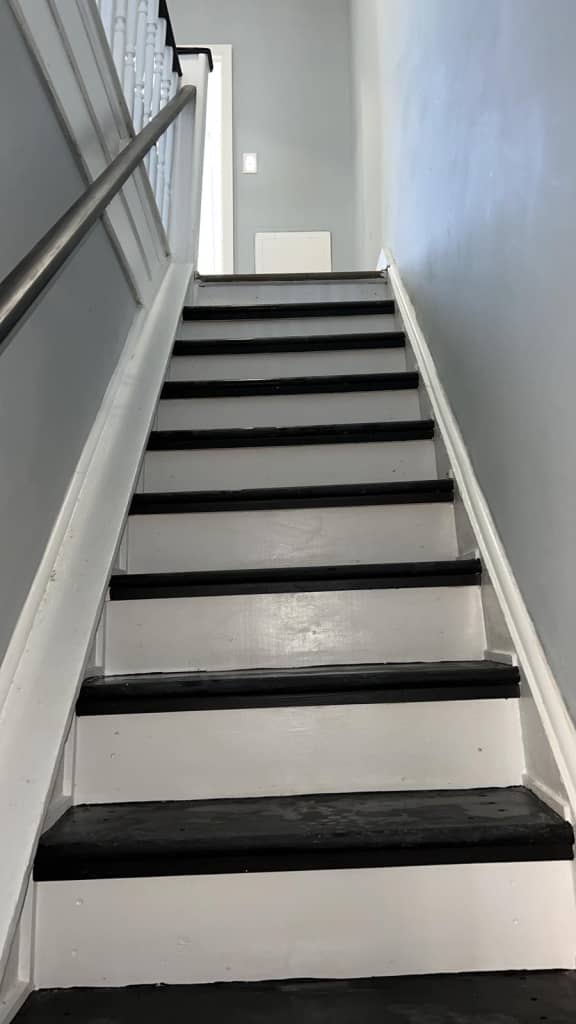
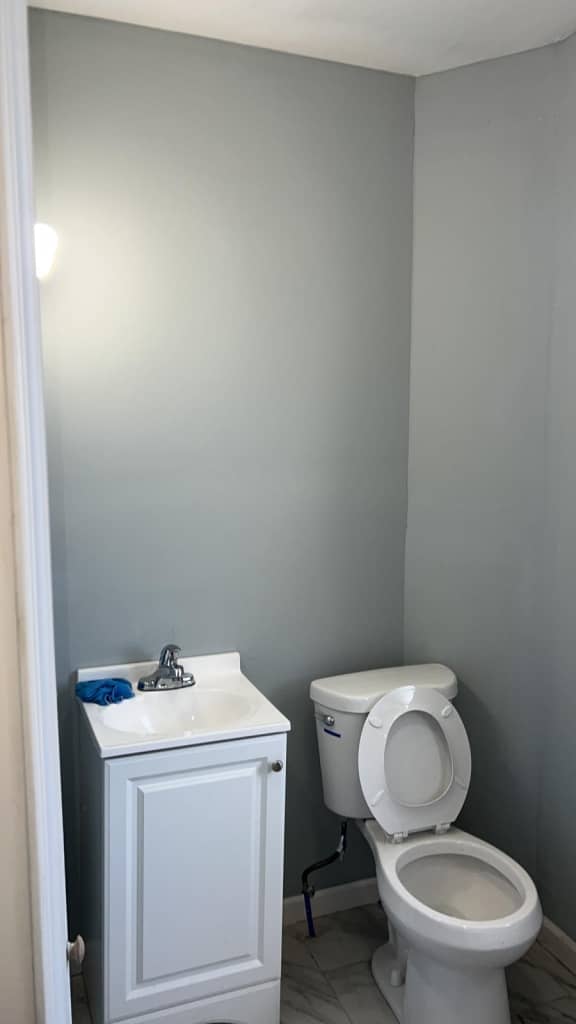
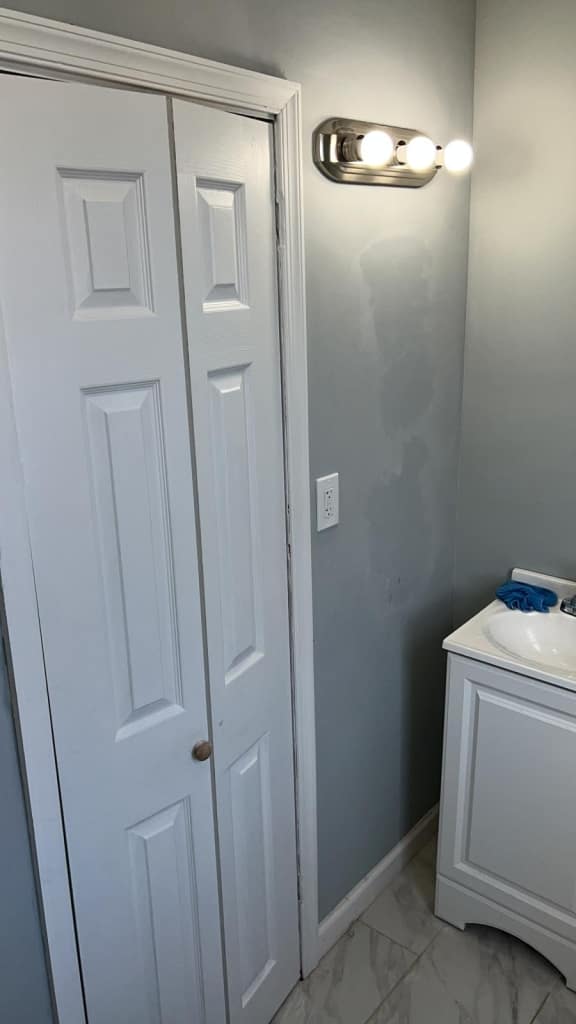
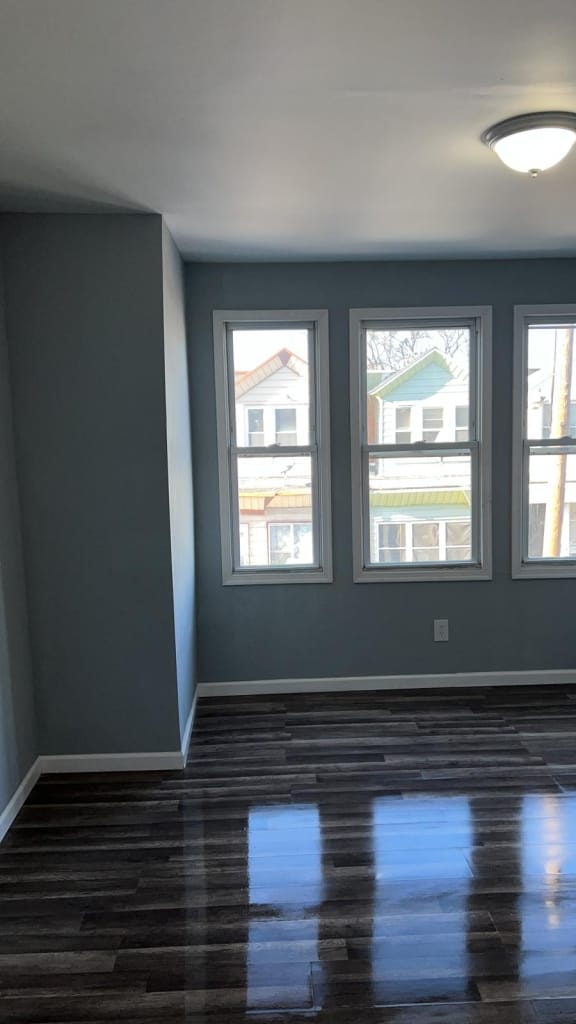
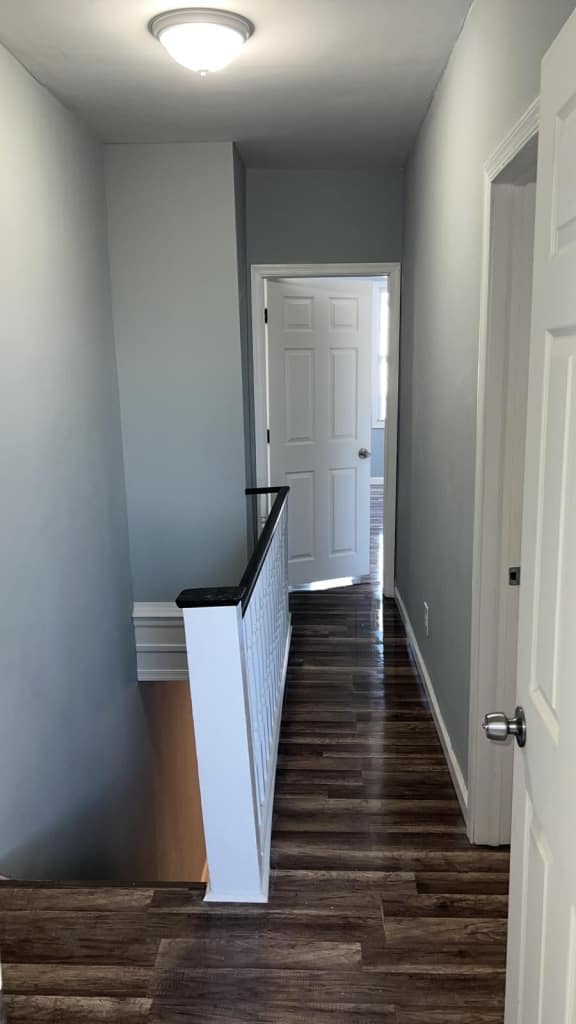
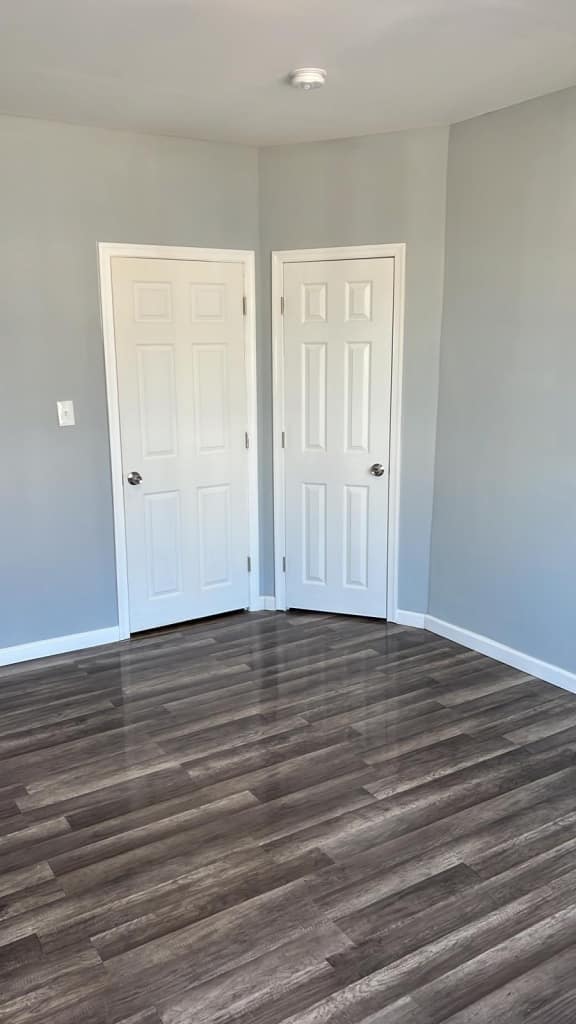
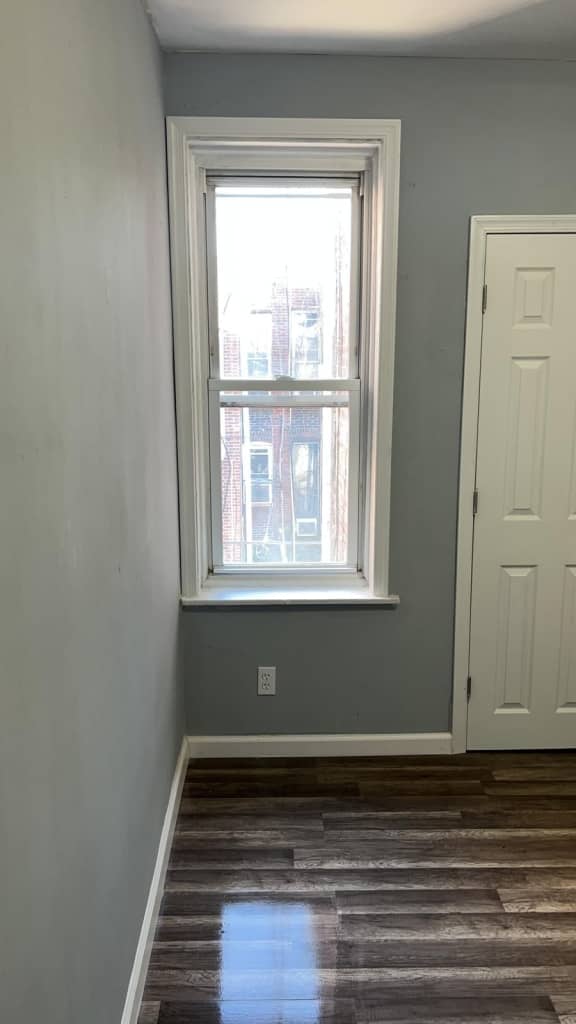
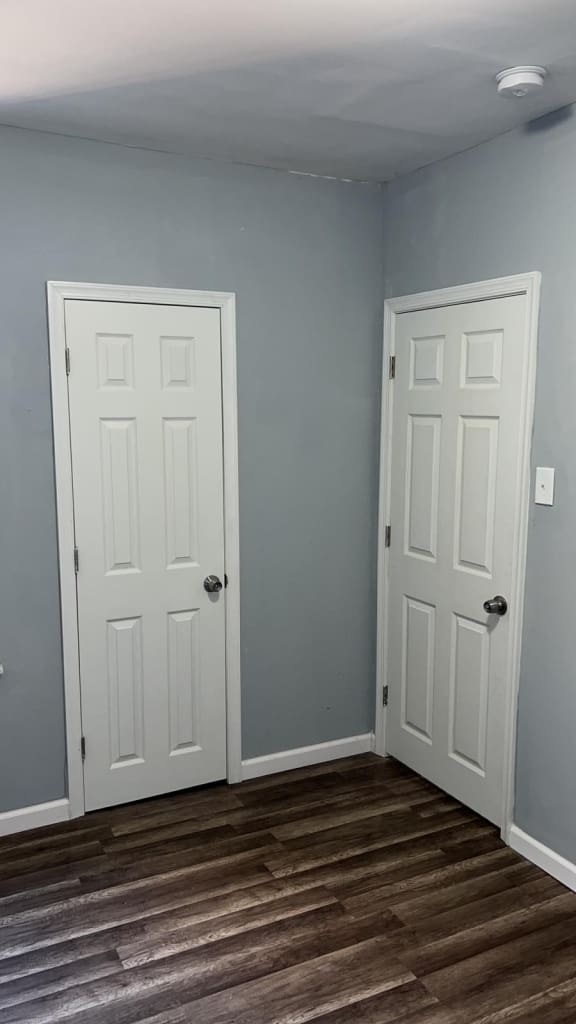
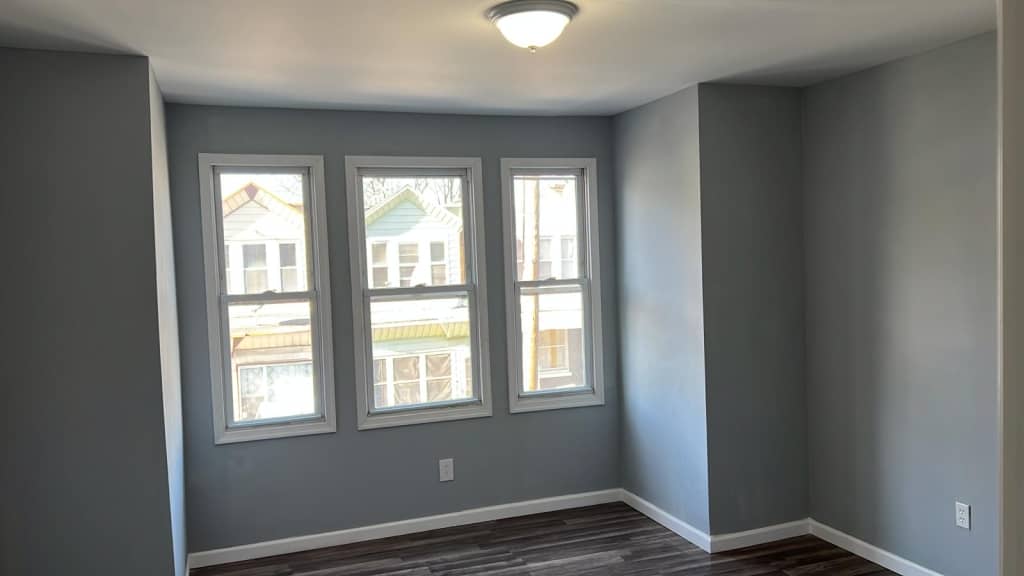
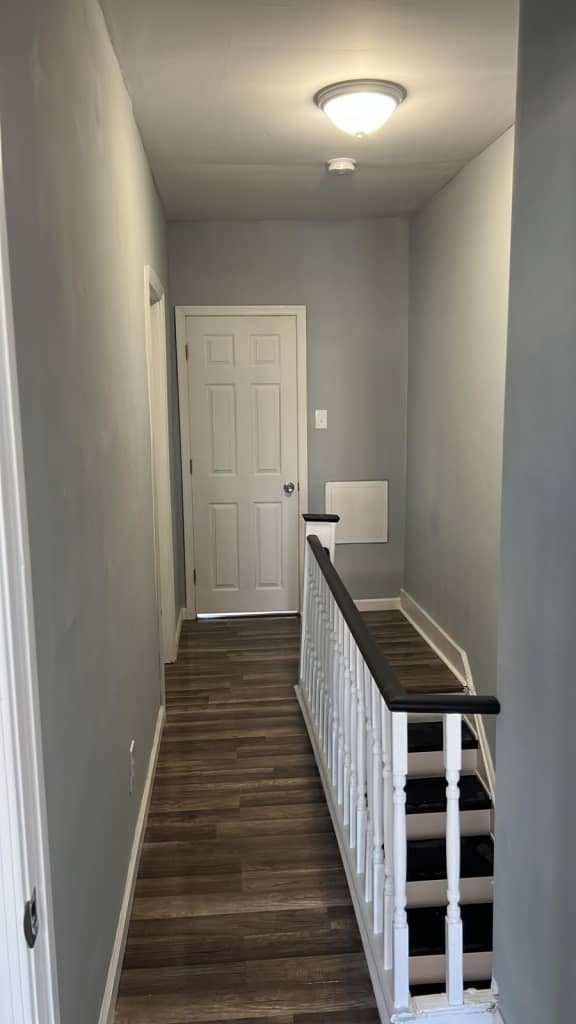
9.23

Property Features

Type:
Single Family Home
Condition:
Fully Renovated as Condition of Closing
Rental Status:
Currently Rented
Year Built:
1925
Bedrooms:
3
Bathrooms:
1.0
Floor Area:
966 Sq Ft
Lot Size:
n/a
Stories:
2 Stories
Basement:
Unfinished
Parking:
Off-Street Parking
RESERVE THIS PROPERTY

Seller's Additional Notes

Philadelphia Highlights

Philadelphia Properties:

  • Fully-Renovated Single Family Homes
  • Tenants and Local Property Management in Place
  • High Demand Philadelphia Locations
  • 12-month rental guarantee when using seller’s Preferred Property Management Company
  • 6-month Scope of Work warranty by seller

Philadelphia Market:

  • Job growth above national average
  • Home prices increased 10% last year
  • Mass-Tourism: Over 4 million visitors annually (one of the U.S.’s top attractions)
  • Mega-College Town: Home to 92 colleges and universities, creating consistent rental demand
  • New $225 Million Waterfront Park Project expected to spur $1.6 Billion in private economic activity and create 2,400 jobs by 2022.

Similar
Properties

Maverick Property Vault

$788 Net Operating Income
$823 Net Operating Income
$649 Net Operating Income
$911 Net Operating Income
$469 Net Operating Income
$524 Net Operating Income
No more properties to show

More Maverick Markets

Subscribe

    GET Access TO Private buying opportunities for TURNKEY Rental properies & EDUCATIONAL RESOURCES. READ OUR PRIVACY NOTICE & TERMS OF USE.

    Maverick's Cash-Flow Calculator

    DISCLAIMER
    OPEN

    This calculator is for recreational use only and is NOT financial or accounting software. There are a litany of variables that may be relevant to determining your individual tax obligations, financial performance and investment returns on a rental property that are NOT factored into this calculator. By using this calculator, you understand that the numbers herein are NOT specific projections of what your returns will actually be, and you agree that it is YOUR DUTY to consult with your own tax and financial professionals about the evaluation, risk assessment, realistic financial expectations, and actual tax obligations associated with any real estate investment. You also understand that ALL real estate investing involves risk, which buyer assumes 100%, and that no specific returns can ever be guaranteed by anyone.

    Top

    INSTRUCTIONS

    Click into any Investor INPUTS (THE ORANGE FIELDS) to modify.
    Click any field LABEL to view a definition.
    Click CALCULATE to update financial calculations on ALL TABS.
    Purchase
    Monthly Cashflow
    Tax Benefits
    Future Assumptions

    INSTRUCTIONS

    Click into any Investor INPUTS (THE ORANGE FIELDS) to modify.
    Click any field LABEL to view a definition.
    Click CALCULATE to update financial calculations on ALL TABS.
    Cash to Purchase
    Purchase Price
    $155,000
    Fair Market Value
    $155,000
    Down Payment Amount
    $31,000
    Depreciable Closing Costs
    $3,000
    Lender Fees / Points
    $3,000
    Total Cash Invested
    $37,000
    Total Equity at Purchase
    $31,000
    Morgage Calculation
    Loan Amount
    $124,000
    Monthly Mortgage Payment
    $666
    First Year Mortgage Principal Paid Down
    $1,829
    First Year Mortgage Interest Paid
    $6,158

    INSTRUCTIONS

    Click into any Investor INPUTS (THE ORANGE FIELDS) to modify.
    Click any field LABEL to view a definition.
    Click CALCULATE to update financial calculations on ALL TABS.
    First Year Monthly Cashflow
    Gross Scheduled Rent
    $1,400
    Vacancy Estimate
    $98
    Gross Operating Income
    $1,302
    Property Taxes
    $150
    Insurance
    $50
    Other Expense
    $0
    Owner-Paid Utilities / Landscaping
    $6
    Property Management Fee
    $140
    Maintenance Estimate
    $70
    Total Operating Expenses
    $416
    Net Operating Income (NOI)
    $886
    Mortgage Payment
    $666
    Cash Flow Before Taxes
    $220
    Gross Rent Multiplier (GRM)
    9.2
    Rent to Value Ratio (RV Ratio)
    0.9%
    Capitalization Rate (Cap Rate)
    6.9%
    Cash on Cash Return
    7.1%

    INSTRUCTIONS

    Click into any Investor INPUTS (THE ORANGE FIELDS) to modify.
    Click any field LABEL to view a definition.
    Click CALCULATE to update financial calculations on ALL TABS.
    Tax Benefits
    Value of (Non-Depreciable) Land
    $15,500
    Value of (Depreciable) Property Structure
    $139,500
    Depreciable "Cost Basis" at Purchase
    $142,500
    Annual Straight Line Depreciation of Cost Basis
    $5,182
    Annual Depreciation of Lender Fees / Costs
    $100
    First Year Total Depreciation
    $5,282
    First Year Taxable Income Before Depreciation
    $4,474
    First Year Taxable Income Offset by Depreciation
    $4,474
    First Year Remaining Taxable Income After Depreciation
    $0
    First Year Federal Income Taxes Owed on Rental Income
    $0
    First Year Tax Savings from Depreciation on Rental Income
    $1,432
    First Year Left Over Depreciation
    $808

    INSTRUCTIONS

    Click into any Investor INPUTS (THE ORANGE FIELDS) to modify.
    Click any field LABEL to view a definition.
    Click CALCULATE to update financial calculations on ALL TABS.
    (Swipe left or right to scroll horizontally)
    Annual Income
    Year 1Year 2Year 3Year 4Year 5Year 6Year 7Year 8Year 9Year 10Year 11Year 12Year 13Year 14Year 15Year 16Year 17Year 18Year 19Year 20Year 21Year 22Year 23Year 24Year 25Year 26Year 27Year 28Year 29Year 30
    Gross Scheduled Rent
    $16,800
    $17,136
    $17,479
    $17,828
    $18,185
    $18,549
    $18,920
    $19,298
    $19,684
    $20,078
    $20,479
    $20,889
    $21,306
    $21,733
    $22,167
    $22,611
    $23,063
    $23,524
    $23,995
    $24,474
    $24,964
    $25,463
    $25,972
    $26,492
    $27,022
    $27,562
    $28,113
    $28,676
    $29,249
    $29,834
    Vacancy Loss
    $1,176
    $1,200
    $1,224
    $1,248
    $1,273
    $1,298
    $1,324
    $1,351
    $1,378
    $1,405
    $1,434
    $1,462
    $1,491
    $1,521
    $1,552
    $1,583
    $1,614
    $1,647
    $1,680
    $1,713
    $1,747
    $1,782
    $1,818
    $1,854
    $1,892
    $1,929
    $1,968
    $2,007
    $2,047
    $2,088
    Gross Operating Income
    $15,624
    $15,936
    $16,255
    $16,580
    $16,912
    $17,250
    $17,595
    $17,947
    $18,306
    $18,672
    $19,046
    $19,426
    $19,815
    $20,211
    $20,616
    $21,028
    $21,448
    $21,877
    $22,315
    $22,761
    $23,216
    $23,681
    $24,154
    $24,637
    $25,130
    $25,633
    $26,145
    $26,668
    $27,202
    $27,746
    Annual Operating Expenses
    Year 1Year 2Year 3Year 4Year 5Year 6Year 7Year 8Year 9Year 10Year 11Year 12Year 13Year 14Year 15Year 16Year 17Year 18Year 19Year 20Year 21Year 22Year 23Year 24Year 25Year 26Year 27Year 28Year 29Year 30
    Property Taxes
    $1,800
    $1,800
    $1,800
    $1,800
    $1,800
    $1,800
    $1,800
    $1,800
    $1,800
    $1,800
    $1,800
    $1,800
    $1,800
    $1,800
    $1,800
    $1,800
    $1,800
    $1,800
    $1,800
    $1,800
    $1,800
    $1,800
    $1,800
    $1,800
    $1,800
    $1,800
    $1,800
    $1,800
    $1,800
    $1,800
    Insurance
    $600
    $600
    $600
    $600
    $600
    $600
    $600
    $600
    $600
    $600
    $600
    $600
    $600
    $600
    $600
    $600
    $600
    $600
    $600
    $600
    $600
    $600
    $600
    $600
    $600
    $600
    $600
    $600
    $600
    $600
    Maintenance Assumption
    $840
    $857
    $874
    $891
    $909
    $927
    $946
    $965
    $984
    $1,004
    $1,024
    $1,044
    $1,065
    $1,087
    $1,108
    $1,131
    $1,153
    $1,176
    $1,200
    $1,224
    $1,248
    $1,273
    $1,299
    $1,325
    $1,351
    $1,378
    $1,406
    $1,434
    $1,462
    $1,492
    Property Management
    $1,680
    $1,714
    $1,748
    $1,783
    $1,818
    $1,855
    $1,892
    $1,930
    $1,968
    $2,008
    $2,048
    $2,089
    $2,131
    $2,173
    $2,217
    $2,261
    $2,306
    $2,352
    $2,399
    $2,447
    $2,496
    $2,546
    $2,597
    $2,649
    $2,702
    $2,756
    $2,811
    $2,868
    $2,925
    $2,983
    Owner-Paid Utilities / Landscaping
    $72
    $72
    $72
    $72
    $72
    $72
    $72
    $72
    $72
    $72
    $72
    $72
    $72
    $72
    $72
    $72
    $72
    $72
    $72
    $72
    $72
    $72
    $72
    $72
    $72
    $72
    $72
    $72
    $72
    $72
    Other Expense
    $0
    $0
    $0
    $0
    $0
    $0
    $0
    $0
    $0
    $0
    $0
    $0
    $0
    $0
    $0
    $0
    $0
    $0
    $0
    $0
    $0
    $0
    $0
    $0
    $0
    $0
    $0
    $0
    $0
    $0
    Total Operating Expenses
    $4,992
    $5,042
    $5,094
    $5,146
    $5,200
    $5,254
    $5,310
    $5,367
    $5,425
    $5,484
    $5,544
    $5,605
    $5,668
    $5,732
    $5,797
    $5,864
    $5,931
    $6,001
    $6,071
    $6,143
    $6,217
    $6,291
    $6,368
    $6,446
    $6,525
    $6,606
    $6,689
    $6,773
    $6,859
    $6,947
    Annual Debt Service
    Year 1Year 2Year 3Year 4Year 5Year 6Year 7Year 8Year 9Year 10Year 11Year 12Year 13Year 14Year 15Year 16Year 17Year 18Year 19Year 20Year 21Year 22Year 23Year 24Year 25Year 26Year 27Year 28Year 29Year 30
    Debt Service
    $7,988
    $7,988
    $7,988
    $7,988
    $7,988
    $7,988
    $7,988
    $7,988
    $7,988
    $7,988
    $7,988
    $7,988
    $7,988
    $7,988
    $7,988
    $7,988
    $7,988
    $7,988
    $7,988
    $7,988
    $7,988
    $7,988
    $7,988
    $7,988
    $7,988
    $7,988
    $7,988
    $7,988
    $7,988
    $7,988
    Mortgage Balance at Year End
    $122,171
    $120,247
    $118,226
    $116,101
    $113,868
    $111,520
    $109,052
    $106,458
    $103,731
    $100,864
    $97,851
    $94,684
    $91,354
    $87,855
    $84,176
    $80,309
    $76,244
    $71,972
    $67,480
    $62,759
    $57,797
    $52,580
    $47,097
    $41,333
    $35,274
    $28,905
    $22,210
    $15,173
    $7,776
    -
    Debt Service Coverage Ratio
    1.33%
    1.36%
    1.4%
    1.43%
    1.47%
    1.5%
    1.54%
    1.57%
    1.61%
    1.65%
    1.69%
    1.73%
    1.77%
    1.81%
    1.86%
    1.9%
    1.94%
    1.99%
    2.03%
    2.08%
    2.13%
    2.18%
    2.23%
    2.28%
    2.33%
    2.38%
    2.44%
    2.49%
    2.55%
    2.6%
    Annual Capital Improvements
    Year 1Year 2Year 3Year 4Year 5Year 6Year 7Year 8Year 9Year 10Year 11Year 12Year 13Year 14Year 15Year 16Year 17Year 18Year 19Year 20Year 21Year 22Year 23Year 24Year 25Year 26Year 27Year 28Year 29Year 30
    Capital Improvements
    $0
    $0
    $0
    $0
    $0
    $0
    $0
    $0
    $0
    $0
    $0
    $0
    $0
    $0
    $0
    $0
    $0
    $0
    $0
    $0
    $0
    $0
    $0
    $0
    $0
    $0
    $0
    $0
    $0
    $0
    Annual Cash Flow Analysis
    Year 1Year 2Year 3Year 4Year 5Year 6Year 7Year 8Year 9Year 10Year 11Year 12Year 13Year 14Year 15Year 16Year 17Year 18Year 19Year 20Year 21Year 22Year 23Year 24Year 25Year 26Year 27Year 28Year 29Year 30
    Net Operating Income
    $10,632
    $10,894
    $11,161
    $11,434
    $11,712
    $11,996
    $12,285
    $12,580
    $12,881
    $13,188
    $13,502
    $13,821
    $14,147
    $14,479
    $14,818
    $15,164
    $15,517
    $15,877
    $16,244
    $16,618
    $17,000
    $17,389
    $17,787
    $18,192
    $18,605
    $19,027
    $19,456
    $19,895
    $20,342
    $20,799
    Capitalization Rate
    6.9%
    7%
    7.2%
    7.4%
    7.6%
    7.7%
    7.9%
    8.1%
    8.3%
    8.5%
    8.7%
    8.9%
    9.1%
    9.3%
    9.6%
    9.8%
    10%
    10.2%
    10.5%
    10.7%
    11%
    11.2%
    11.5%
    11.7%
    12%
    12.3%
    12.6%
    12.8%
    13.1%
    13.4%
    Cash Flow Before Taxes
    $2,644
    $2,906
    $3,173
    $3,446
    $3,724
    $4,008
    $4,297
    $4,592
    $4,894
    $5,201
    $5,514
    $5,833
    $6,159
    $6,492
    $6,831
    $7,176
    $7,529
    $7,889
    $8,256
    $8,630
    $9,012
    $9,401
    $9,799
    $10,204
    $10,617
    $11,039
    $11,469
    $11,907
    $12,354
    $12,811
    Cash on Cash Return
    7.1%
    7.9%
    8.6%
    9.3%
    10.1%
    10.8%
    11.6%
    12.4%
    13.2%
    14.1%
    14.9%
    15.8%
    16.6%
    17.5%
    18.5%
    19.4%
    20.3%
    21.3%
    22.3%
    23.3%
    24.4%
    25.4%
    26.5%
    27.6%
    28.7%
    29.8%
    31%
    32.2%
    33.4%
    34.6%
    Annual Equity Accumulation
    Year 1Year 2Year 3Year 4Year 5Year 6Year 7Year 8Year 9Year 10Year 11Year 12Year 13Year 14Year 15Year 16Year 17Year 18Year 19Year 20Year 21Year 22Year 23Year 24Year 25Year 26Year 27Year 28Year 29Year 30
    Property Appreciation
    $6,200
    $6,448
    $6,706
    $6,974
    $7,253
    $7,543
    $7,845
    $8,159
    $8,485
    $8,825
    $9,178
    $9,545
    $9,926
    $10,323
    $10,736
    $11,166
    $11,612
    $12,077
    $12,560
    $13,062
    $13,585
    $14,128
    $14,693
    $15,281
    $15,892
    $16,528
    $17,189
    $17,877
    $18,592
    $19,336
    Mortgage Principal Pay Down
    $1,829
    $1,923
    $2,021
    $2,125
    $2,234
    $2,348
    $2,468
    $2,594
    $2,727
    $2,866
    $3,013
    $3,167
    $3,329
    $3,500
    $3,679
    $3,867
    $4,065
    $4,273
    $4,491
    $4,721
    $4,963
    $5,217
    $5,483
    $5,764
    $6,059
    $6,369
    $6,695
    $7,037
    $7,397
    $7,776
    Total Equity Growth
    $8,029
    $8,371
    $8,727
    $9,099
    $9,487
    $9,891
    $10,313
    $10,753
    $11,212
    $11,691
    $12,191
    $12,712
    $13,256
    $13,823
    $14,415
    $15,033
    $15,677
    $16,350
    $17,051
    $17,784
    $18,548
    $19,345
    $20,177
    $21,045
    $21,951
    $22,897
    $23,884
    $24,914
    $25,989
    $27,111
    Annual Tax Savings From Depreciation
    Year 1Year 2Year 3Year 4Year 5Year 6Year 7Year 8Year 9Year 10Year 11Year 12Year 13Year 14Year 15Year 16Year 17Year 18Year 19Year 20Year 21Year 22Year 23Year 24Year 25Year 26Year 27Year 28Year 29Year 30
    Straight Line Depreciation of Cost Basis
    $5,282
    $5,282
    $5,282
    $5,282
    $5,282
    $5,282
    $5,282
    $5,282
    $5,282
    $5,282
    $5,282
    $5,282
    $5,282
    $5,282
    $5,282
    $5,282
    $5,282
    $5,282
    $5,282
    $5,282
    $5,282
    $5,282
    $5,282
    $5,282
    $5,282
    $5,282
    $5,282
    $2,641
    $0
    $0
    Straight Line Depreciaiton of Lender Fees / Points
    $100
    $100
    $100
    $100
    $100
    $100
    $100
    $100
    $100
    $100
    $100
    $100
    $100
    $100
    $100
    $100
    $100
    $100
    $100
    $100
    $100
    $100
    $100
    $100
    $100
    $100
    $100
    $100
    $100
    $100
    Total Straight Line Depreciation
    $5,382
    $5,382
    $5,382
    $5,382
    $5,382
    $5,382
    $5,382
    $5,382
    $5,382
    $5,382
    $5,382
    $5,382
    $5,382
    $5,382
    $5,382
    $5,382
    $5,382
    $5,382
    $5,382
    $5,382
    $5,382
    $5,382
    $5,382
    $5,382
    $5,382
    $5,382
    $5,382
    $2,741
    $100
    $100
    Taxable Income Before Depreciation
    $4,474
    $4,829
    $5,195
    $5,571
    $5,958
    $6,356
    $6,765
    $7,187
    $7,620
    $8,067
    $8,527
    $9,001
    $9,488
    $9,991
    $10,509
    $11,043
    $11,594
    $12,162
    $12,747
    $13,351
    $13,975
    $14,618
    $15,282
    $15,968
    $16,676
    $17,407
    $18,163
    $18,944
    $19,752
    $20,586
    Carry Forward Loss From Depreciation
    $908
    $1,461
    $1,648
    $1,459
    $883
    $0
    $0
    $0
    $0
    $0
    $0
    $0
    $0
    $0
    $0
    $0
    $0
    $0
    $0
    $0
    $0
    $0
    $0
    $0
    $0
    $0
    $0
    $0
    $0
    $0
    Taxable Income Offset by Depreciation
    $4,474
    $4,829
    $5,195
    $5,571
    $5,958
    $6,264
    $5,382
    $5,382
    $5,382
    $5,382
    $5,382
    $5,382
    $5,382
    $5,382
    $5,382
    $5,382
    $5,382
    $5,382
    $5,382
    $5,382
    $5,382
    $5,382
    $5,382
    $5,382
    $5,382
    $5,382
    $5,382
    $2,741
    $100
    $100
    Remaining Taxable Income After Depreciation
    $0
    $0
    $0
    $0
    $0
    $91
    $1,383
    $1,805
    $2,239
    $2,685
    $3,145
    $3,619
    $4,107
    $4,609
    $5,127
    $5,661
    $6,212
    $6,780
    $7,365
    $7,969
    $8,593
    $9,236
    $9,900
    $10,586
    $11,294
    $12,026
    $12,781
    $16,203
    $19,652
    $20,486
    Federal Income Tax Owed on Rental Income
    $0
    $0
    $0
    $0
    $0
    $29
    $443
    $578
    $716
    $859
    $1,006
    $1,158
    $1,314
    $1,475
    $1,641
    $1,812
    $1,988
    $2,170
    $2,357
    $2,550
    $2,750
    $2,956
    $3,168
    $3,388
    $3,614
    $3,848
    $4,090
    $5,185
    $6,289
    $6,556
    Tax Savings from Depreciation
    $1,432
    $1,545
    $1,662
    $1,783
    $1,907
    $2,005
    $1,722
    $1,722
    $1,722
    $1,722
    $1,722
    $1,722
    $1,722
    $1,722
    $1,722
    $1,722
    $1,722
    $1,722
    $1,722
    $1,722
    $1,722
    $1,722
    $1,722
    $1,722
    $1,722
    $1,722
    $1,722
    $877
    $32
    $32
    Cash Flow After Taxes
    $2,644
    $2,906
    $3,173
    $3,446
    $3,724
    $3,979
    $3,855
    $4,015
    $4,177
    $4,341
    $4,507
    $4,675
    $4,845
    $5,017
    $5,190
    $5,365
    $5,541
    $5,719
    $5,899
    $6,080
    $6,262
    $6,446
    $6,631
    $6,816
    $7,003
    $7,190
    $7,379
    $6,722
    $6,066
    $6,255
    Performance Over Time
    Year 1Year 2Year 3Year 4Year 5Year 6Year 7Year 8Year 9Year 10Year 11Year 12Year 13Year 14Year 15Year 16Year 17Year 18Year 19Year 20Year 21Year 22Year 23Year 24Year 25Year 26Year 27Year 28Year 29Year 30
    Fair Market Property Value at Year End
    $161,200
    $167,648
    $174,354
    $181,328
    $188,581
    $196,124
    $203,969
    $212,128
    $220,613
    $229,438
    $238,615
    $248,160
    $258,086
    $268,410
    $279,146
    $290,312
    $301,925
    $314,002
    $326,562
    $339,624
    $353,209
    $367,337
    $382,031
    $397,312
    $413,205
    $429,733
    $446,922
    $464,799
    $483,391
    $502,727
    Cumulative Appreciation
    $6,200
    $12,648
    $19,354
    $26,328
    $33,581
    $41,124
    $48,969
    $57,128
    $65,613
    $74,438
    $83,615
    $93,160
    $103,086
    $113,410
    $124,146
    $135,312
    $146,925
    $159,002
    $171,562
    $184,624
    $198,209
    $212,337
    $227,031
    $242,312
    $258,205
    $274,733
    $291,922
    $309,799
    $328,391
    $347,727
    Cumulative Mortgage Principal Paydown
    $1,829
    $3,753
    $5,774
    $7,899
    $10,132
    $12,480
    $14,948
    $17,542
    $20,269
    $23,136
    $26,149
    $29,316
    $32,646
    $36,145
    $39,824
    $43,691
    $47,756
    $52,028
    $56,520
    $61,241
    $66,203
    $71,420
    $76,903
    $82,667
    $88,726
    $95,095
    $101,790
    $108,827
    $116,224
    $124,000
    Total Cumulative Equity
    $39,029
    $47,401
    $56,128
    $65,227
    $74,714
    $84,605
    $94,918
    $105,671
    $116,883
    $128,574
    $140,764
    $153,476
    $166,732
    $180,555
    $194,970
    $210,003
    $225,680
    $242,030
    $259,081
    $276,865
    $295,412
    $314,757
    $334,934
    $355,980
    $377,931
    $400,828
    $424,712
    $449,626
    $475,615
    $502,727
    Cumulative Cash Flow Before Taxes
    $2,644
    $5,550
    $8,724
    $12,170
    $15,894
    $19,902
    $24,200
    $28,792
    $33,685
    $38,886
    $44,400
    $50,233
    $56,392
    $62,884
    $69,714
    $76,891
    $84,420
    $92,309
    $100,564
    $109,195
    $118,207
    $127,608
    $137,407
    $147,610
    $158,227
    $169,266
    $180,735
    $192,642
    $204,996
    $217,807
    Cumulative Tax Savings From Depreciation
    $1,432
    $2,977
    $4,639
    $6,422
    $8,329
    $10,333
    $12,055
    $13,777
    $15,500
    $17,222
    $18,944
    $20,666
    $22,388
    $24,111
    $25,833
    $27,555
    $29,277
    $30,999
    $32,721
    $34,444
    $36,166
    $37,888
    $39,610
    $41,332
    $43,055
    $44,777
    $46,499
    $47,376
    $47,408
    $47,440
    Cumulative Cash Flow After Taxes
    $2,644
    $5,550
    $8,724
    $12,170
    $15,894
    $19,873
    $23,728
    $27,742
    $31,920
    $36,261
    $40,768
    $45,444
    $50,289
    $55,305
    $60,495
    $65,860
    $71,401
    $77,120
    $83,019
    $89,099
    $95,361
    $101,807
    $108,438
    $115,254
    $122,257
    $129,447
    $136,826
    $143,548
    $149,614
    $155,869
    Total Net Profit if Sold
    -
    $2,539
    $13,903
    $25,891
    $38,521
    $51,788
    $65,328
    $79,443
    $94,153
    $109,480
    $125,443
    $142,067
    $159,374
    $177,387
    $196,133
    $215,638
    $235,927
    $257,030
    $278,975
    $301,794
    $325,517
    $350,177
    $375,809
    $402,448
    $430,131
    $458,896
    $488,784
    $518,990
    $549,558
    $581,377
    Total Return on Investment if Sold
    -
    6.86%
    37.58%
    69.97%
    104.11%
    139.97%
    176.56%
    214.71%
    254.47%
    295.89%
    339.04%
    383.96%
    430.74%
    479.43%
    530.09%
    582.8%
    637.64%
    694.68%
    753.99%
    815.66%
    879.78%
    946.43%
    1015.7%
    1087.7%
    1162.52%
    1240.26%
    1321.04%
    1402.68%
    1485.29%
    1571.29%
    Before-Tax Return on Investment if Held
    28.8%
    30.5%
    32.2%
    33.9%
    35.7%
    37.6%
    39.5%
    41.5%
    43.5%
    45.7%
    47.8%
    50.1%
    52.5%
    54.9%
    57.4%
    60%
    62.7%
    65.5%
    68.4%
    71.4%
    74.5%
    77.7%
    81%
    84.5%
    88%
    91.7%
    95.5%
    99.5%
    103.6%
    107.9%
    After-Tax Return on Investment if Held
    28.8%
    30.5%
    32.2%
    33.9%
    35.7%
    37.5%
    38.3%
    39.9%
    41.6%
    43.3%
    45.1%
    47%
    48.9%
    50.9%
    53%
    55.1%
    57.3%
    59.6%
    62%
    64.5%
    67.1%
    69.7%
    72.5%
    75.3%
    78.3%
    81.3%
    84.5%
    85.5%
    86.6%
    90.2%
    Internal Rate of Return (IRR)
    -
    3.5%
    12%
    15.5%
    17.1%
    17.8%
    18.1%
    18.2%
    18.1%
    17.9%
    17.8%
    17.6%
    17.4%
    17.2%
    17%
    16.8%
    16.6%
    16.4%
    16.2%
    16.1%
    15.9%
    15.8%
    15.6%
    15.5%
    15.4%
    15.3%
    15.1%
    15%
    14.9%
    14.9%