Own Cash-Flowing Rental Properties in the Best U.S. Markets From Anywhere!

Search
Close this search box.

Welcome to Kansas City!

ABOUT Kansas City

A number of unique market forces are coalescing to make Kansas City uniquely favorable for real estate investors right now. Kansas City home prices have appreciated over 14% in the last year (FHFA), and KC maintains one of the Top 10 Lowest Unemployment Rates in the U.S. among large MSAs. One of the main growth drivers is that Kansas City is being developed as a strategic rail-hub to serve all points in the U.S. and BNSF Railway Company is the anchor of a $1.45 Billion project that is already underway. Warren Buffet’s company Berkshire Hathaway has invested $44 Billion into freight transport run by BNSF. On top of that, the Cerner Corporation has begun construction on a $4.5 Billion campus that is expected to create 16,000 jobs. (Source: 435mag.com).

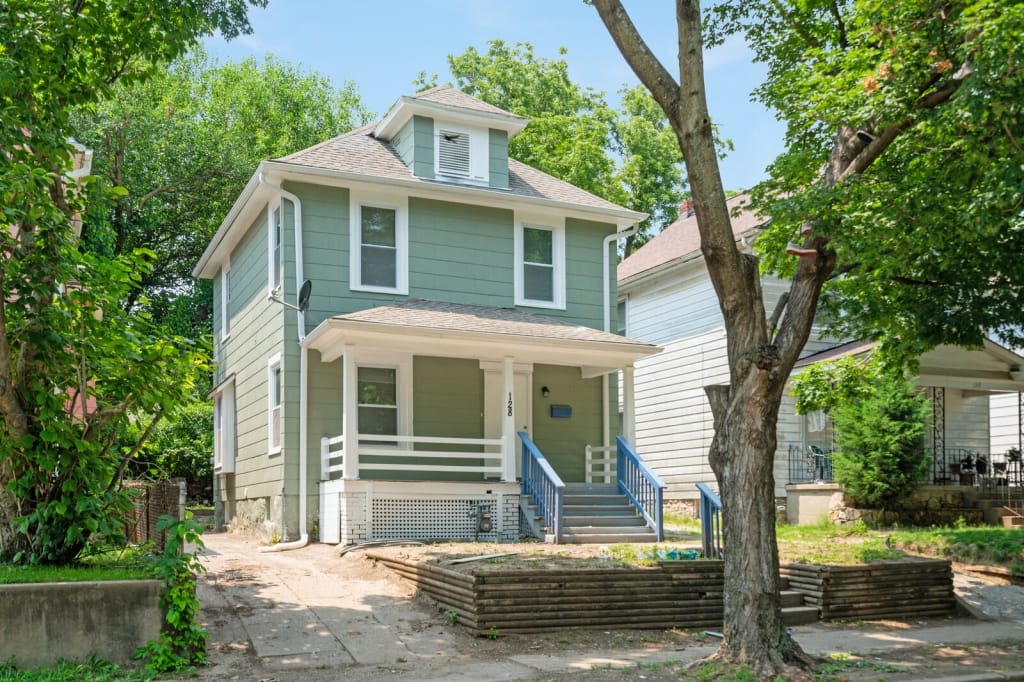
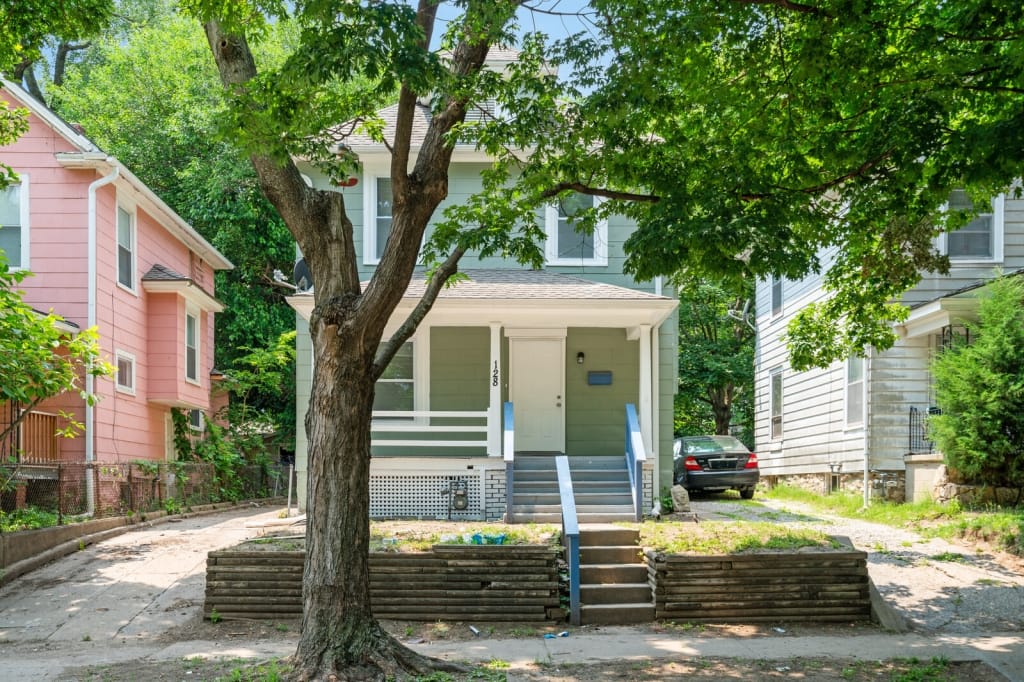
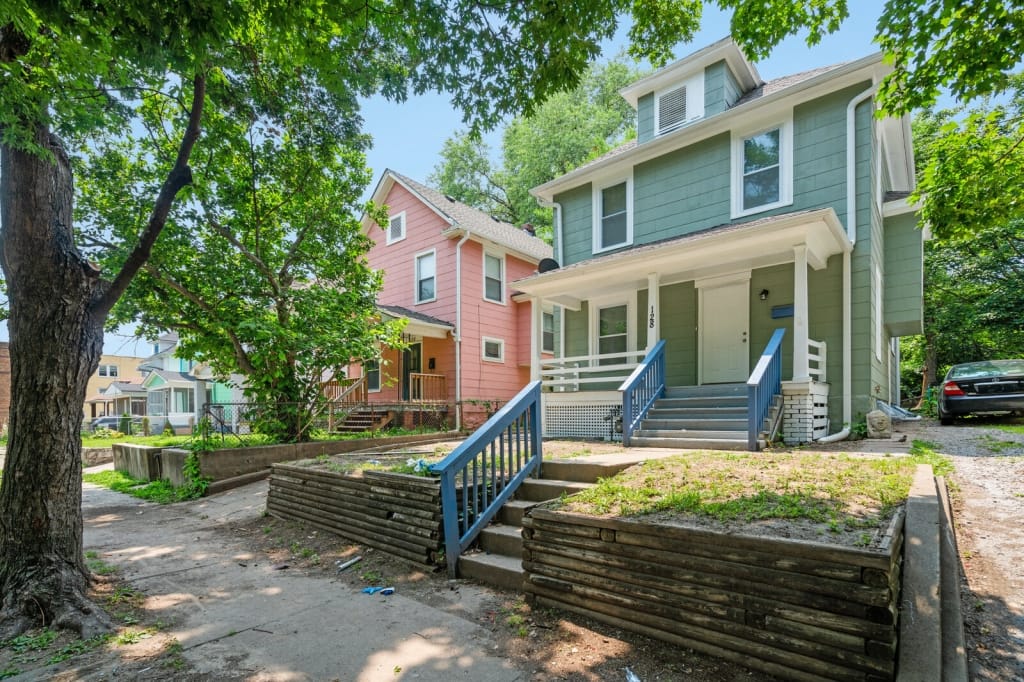
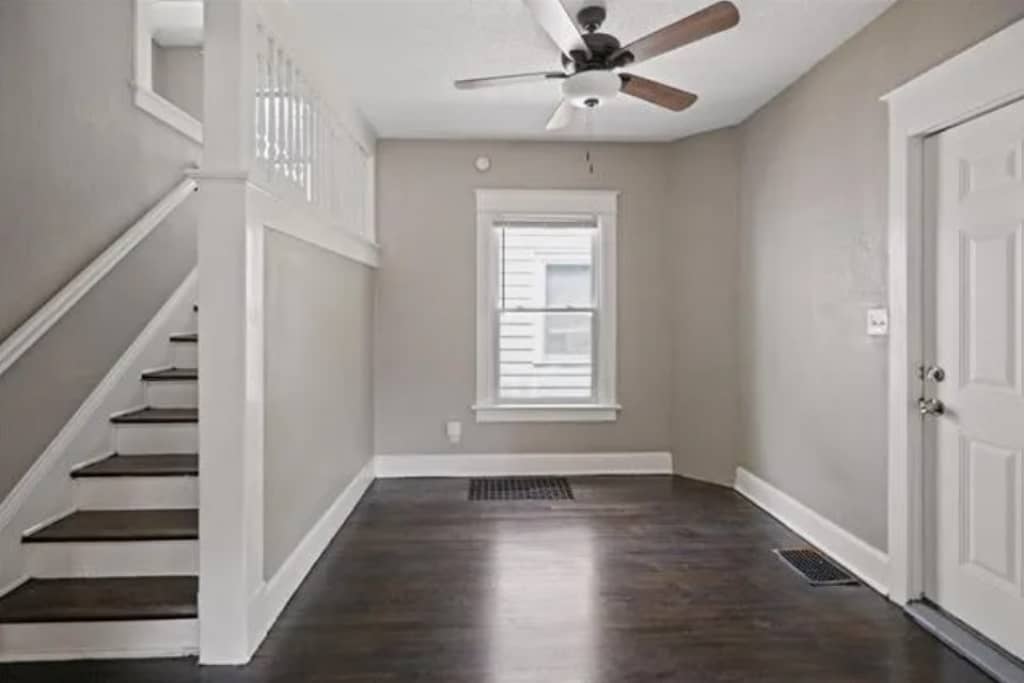
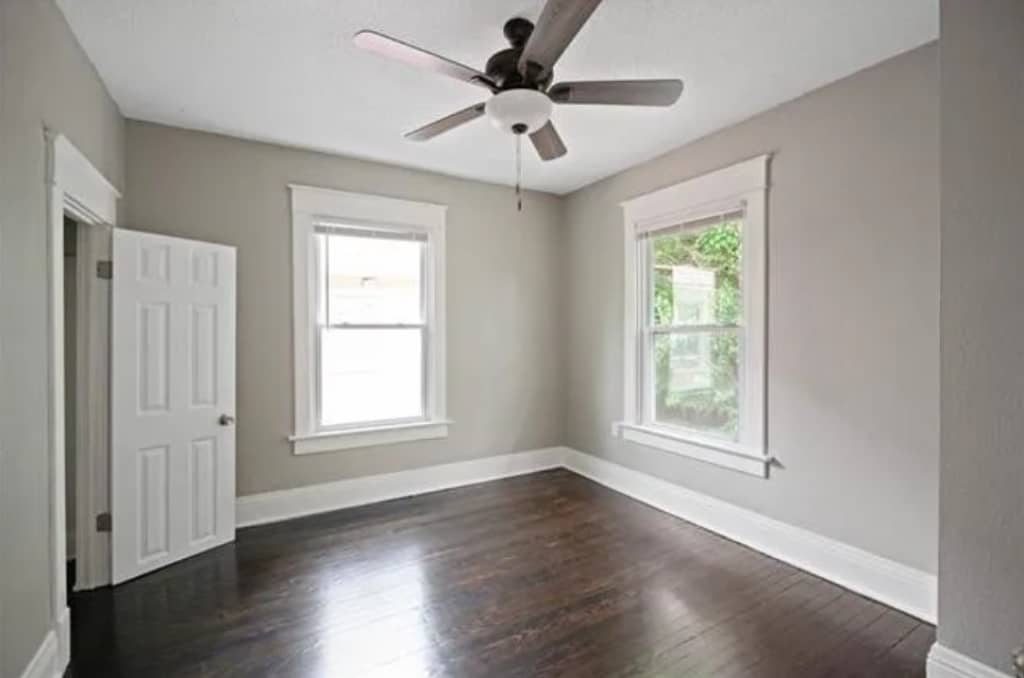
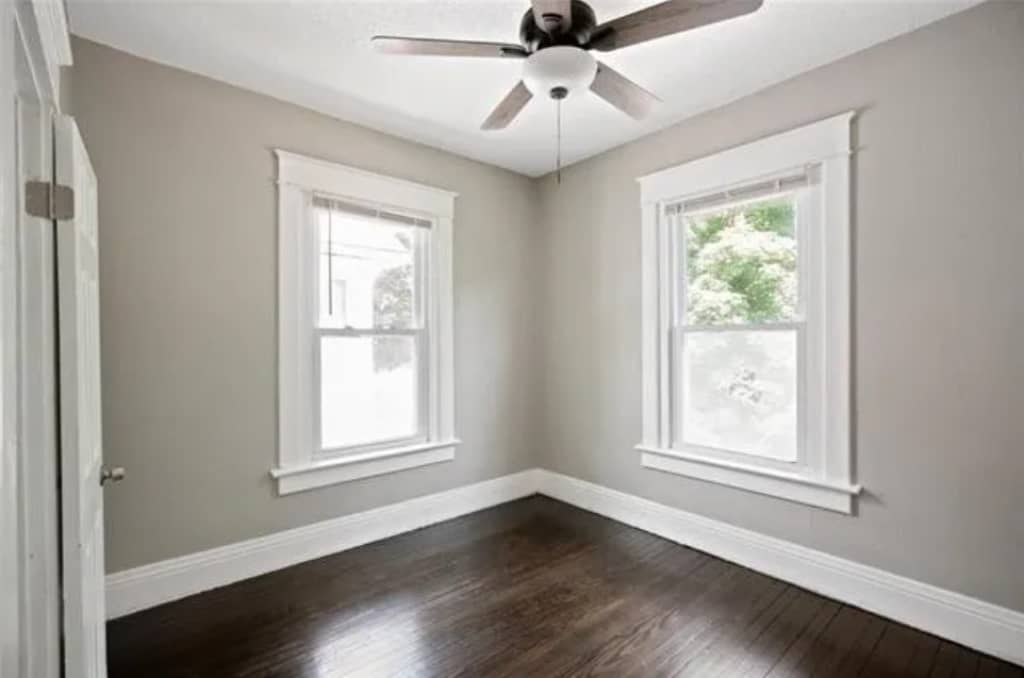
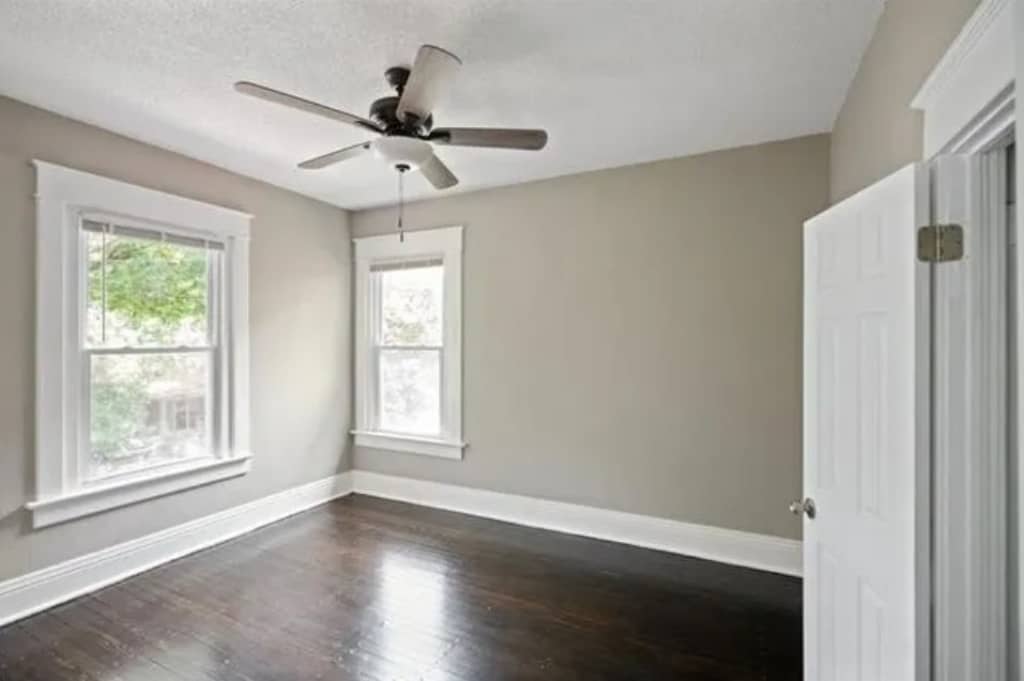
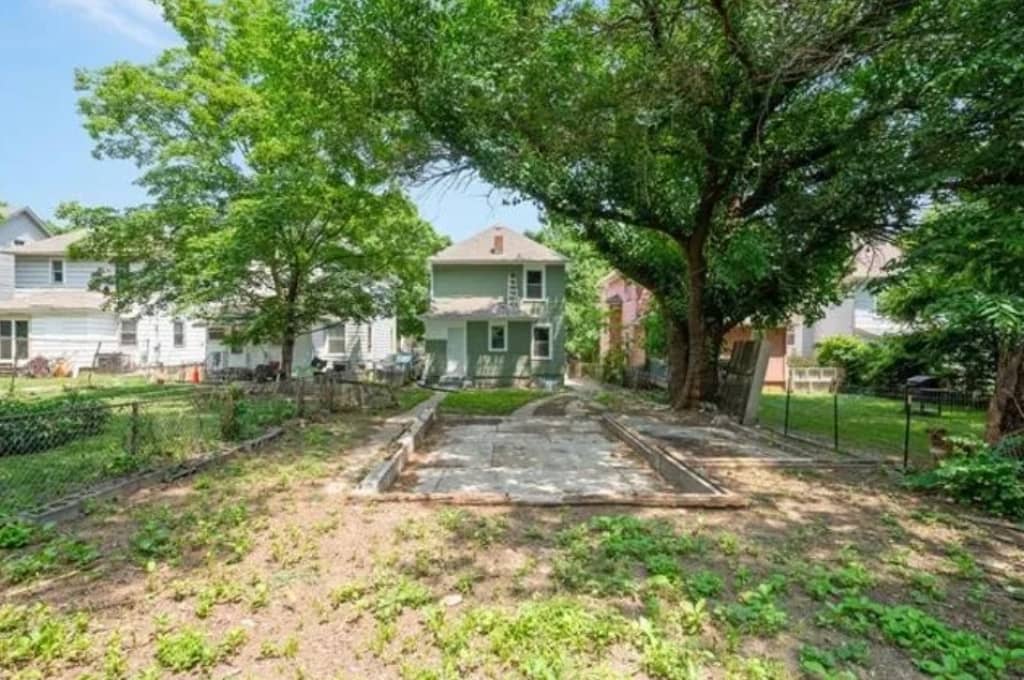
North White Avenue Kansas City, MO

RESERVE THIS PROPERTY

OFFERED BY THE SELLER

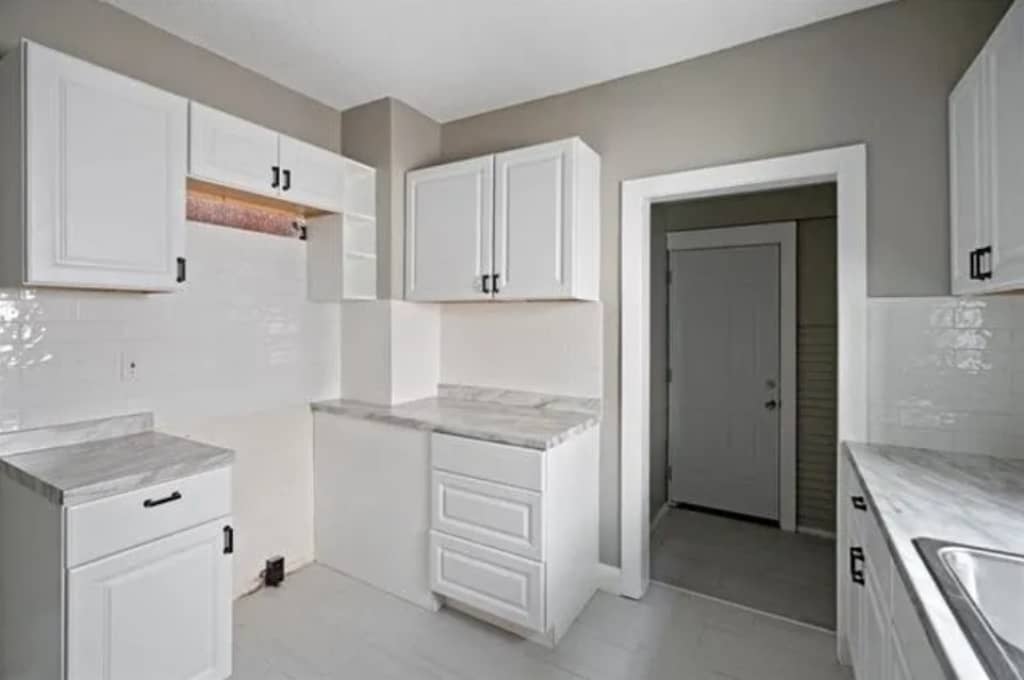
  • 90 Day Scope of Work Warranty

Snapshot Financials

Price:
$ 170000
Rent:
$ 1454 / mo
Taxes:

Estimated Property Taxes

$ 63.5833
Insurance:

Estimated Insurance

$ 600
HOA Fee:

Home Owners Association Fee

$ 0
PM Fee:

Property Management Fee

$ 124
Other:
$ 0
Other:
$ 0
Vacancy:

Based on 7%

$ 101.78
Repairs:

Based on 5%

$ 72.7
Total:

Total Monthly Expenses

$ 412.063
NOI:

Monthly Net Operating Income ('NOI') = Monthly Gross Scheduled Rent - Monthly Operating Expenses - 5% Maintenance Estimate - 7% Vacancy Estimates. NOI does not take into account any financing that you may be using. The NOI is always an 'estimate' and can never be guaranteed because it includes the non-fixed variables of 'maintenance' and 'vacancy' which vary over time.

$ 1042 / mo
Cap Rate:

Capitalization Rate ('Cap Rate') = Annual Net Operating Income / Purchase Price. Cap Rate does not take into account any financing you may be using nor any closing costs you may be paying.

7.35 %
GRM:

Gross Rent Multiplier ('GRM') = Purchase Price / Annual Gross Scheduled Rent. GRM is only a price to rent ratio and does not take into account any operating expenses, financing, closing cost payments or maintenance and vacancy assumptions. And remember, GRM is like a golf score, the lower the better.
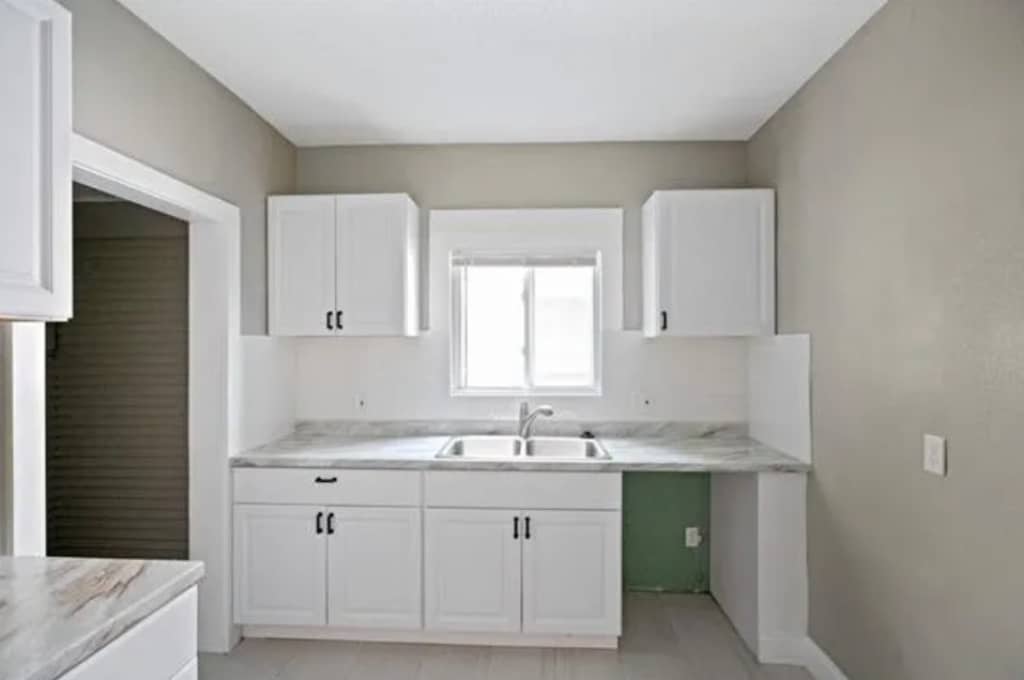
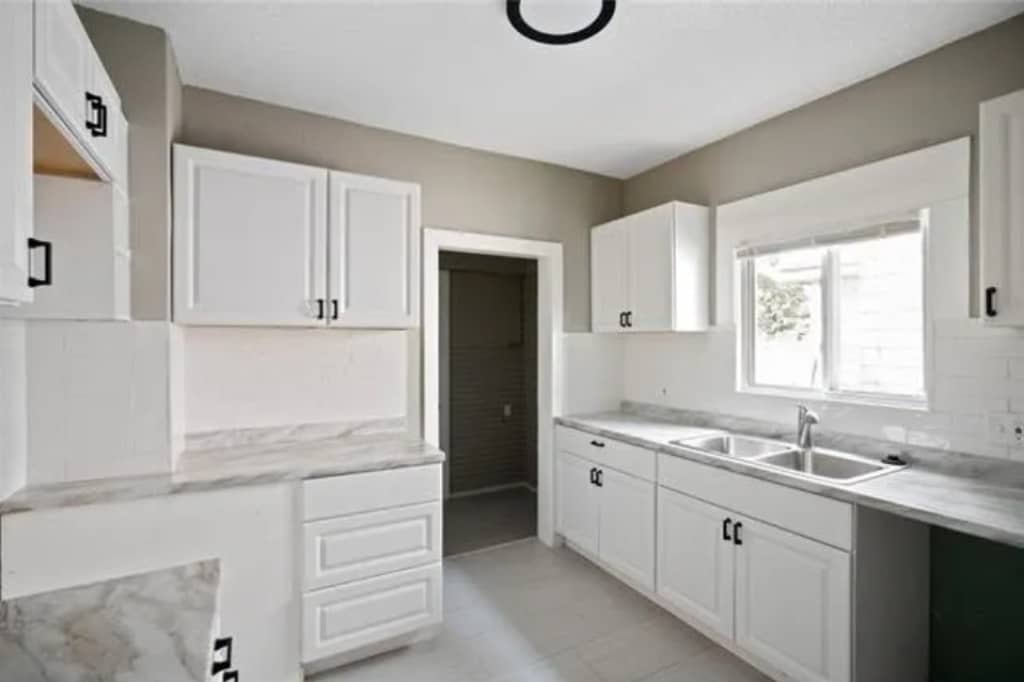
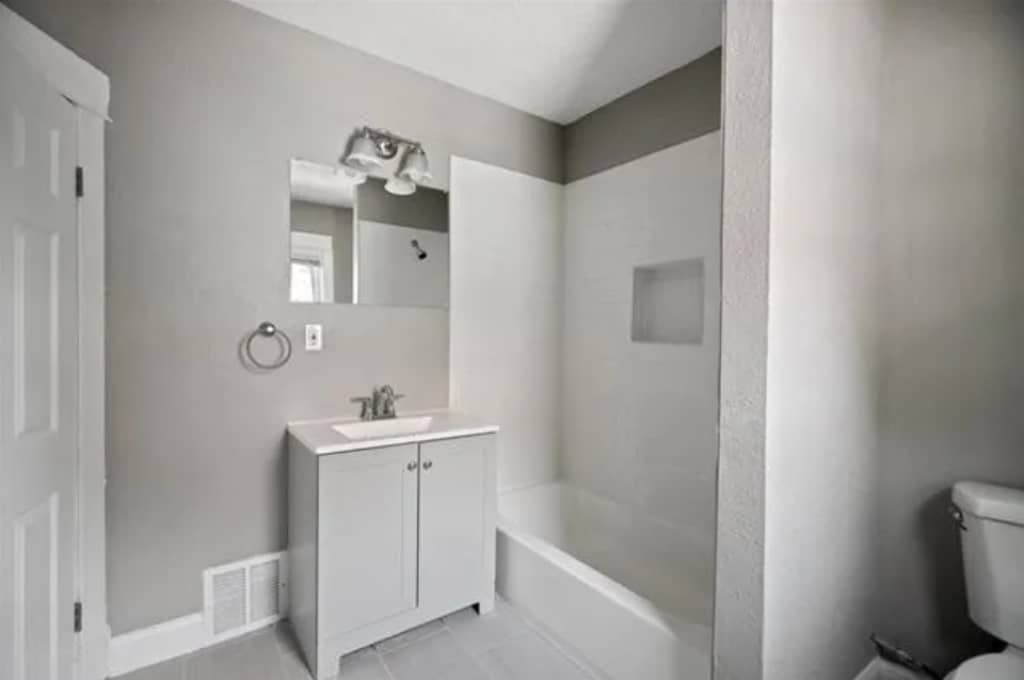
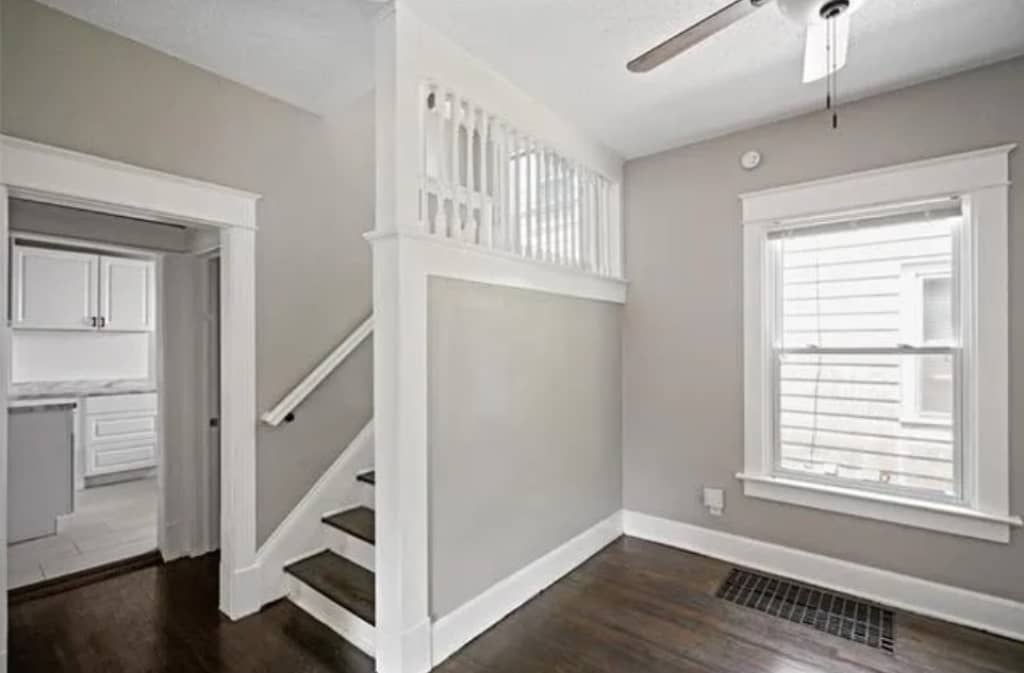
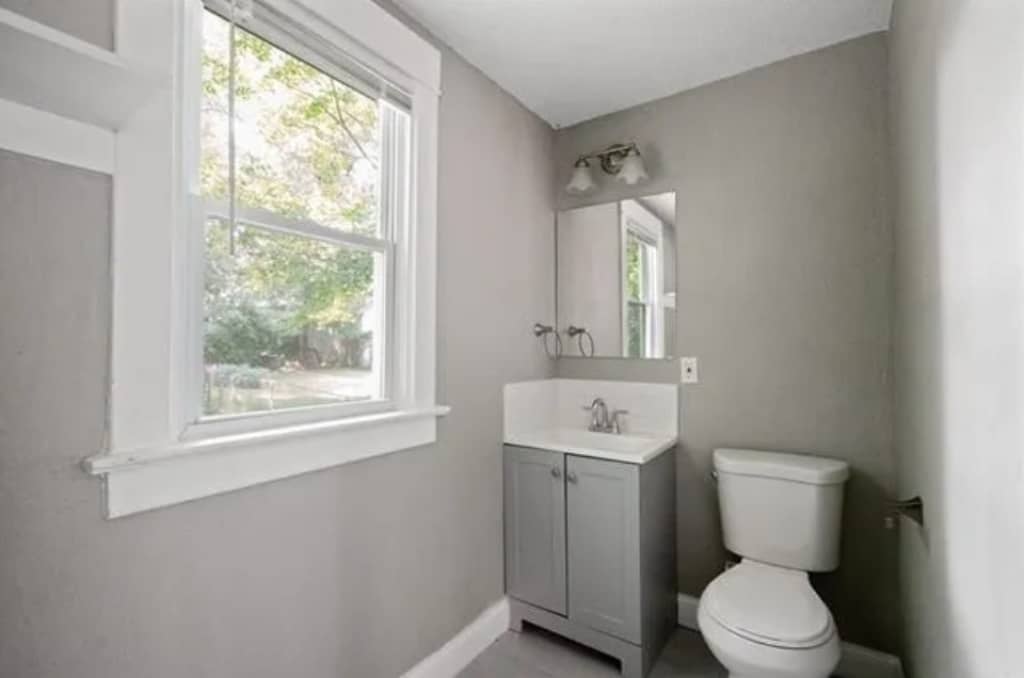
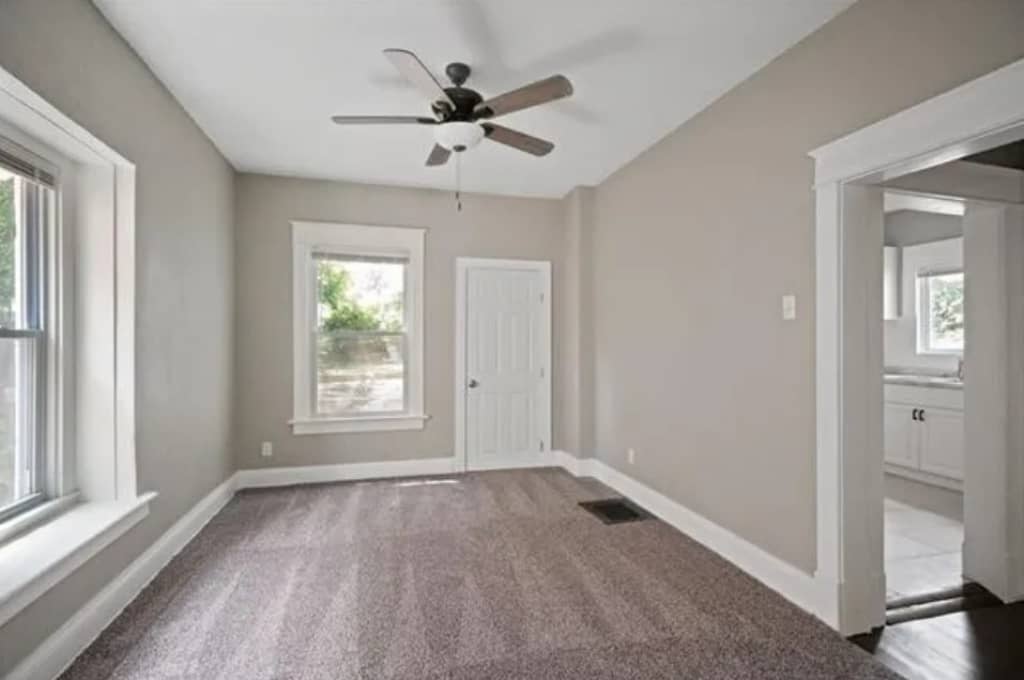
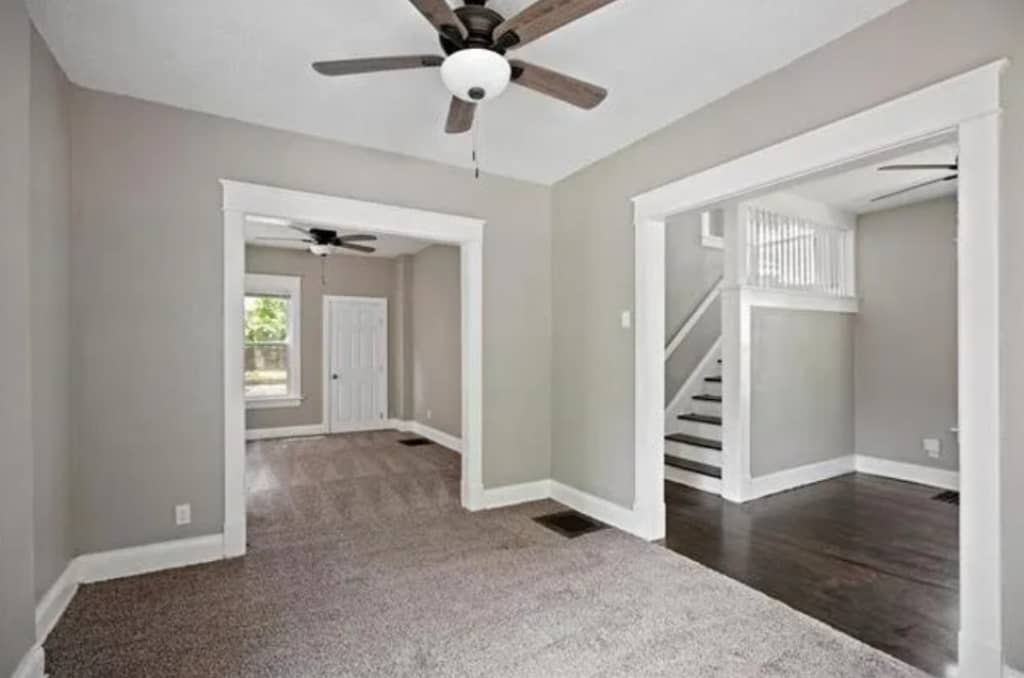
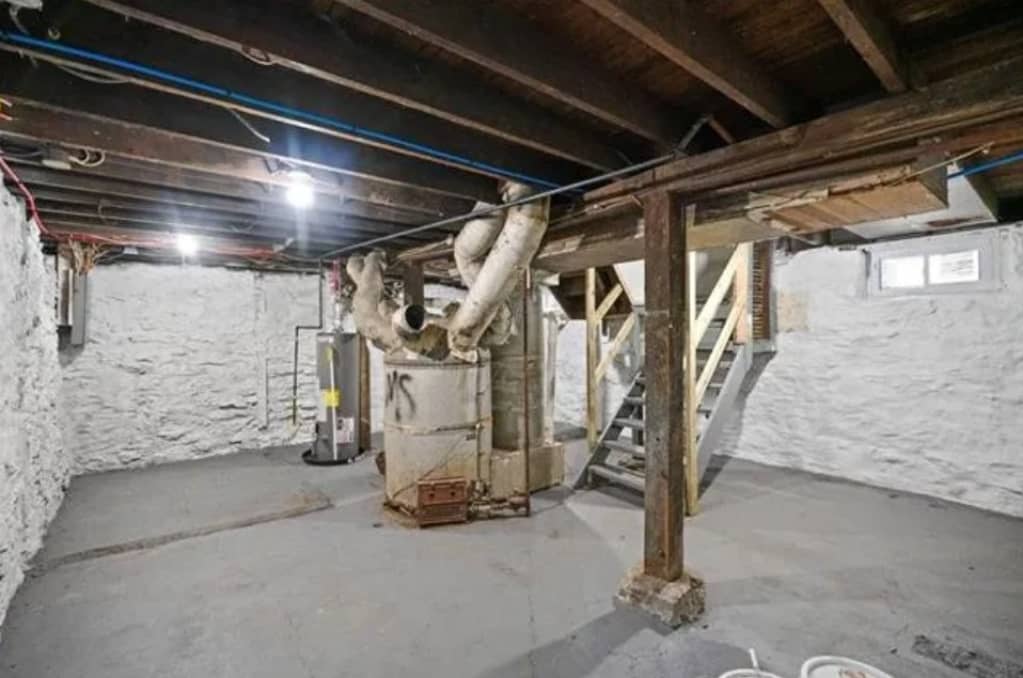
9.74

Property Features

Type:
Single Family Home
Condition:
Fully Renovated as Condition of Closing
Rental Status:
Tenant in Place as Condition of Closing
Year Built:
1905
Bedrooms:
3
Bathrooms:
1.5
Floor Area:
1210 Sq Ft
Lot Size:
4,786 Sq Ft
Stories:
2 Stories
Basement:
Unfinished
Parking:
Off-Street Parking
RESERVE THIS PROPERTY

Seller's Additional Notes

  • New HVAC
  • New Hot Water Heater

Kansas City Highlights

Kansas City Properties:

  • Fully-Renovated Single Family Homes
  • Tenants and Local Property Management in Place as Condition of Closing
  • $125,000 Average Purchase Price
  • 6.5% Average Cap Rates

Kansas City Market:

  • Multi-Billion Dollar Development Projects Around the City
  • Job Creation
  • Population Growth
  • Increasing Rental Demand for Suburban Single Family Homes

Similar
Properties

Maverick Property Vault

$998 Net Operating Income
$786 Net Operating Income

More Maverick Markets

Subscribe

    GET Access TO Private buying opportunities for TURNKEY Rental properies & EDUCATIONAL RESOURCES. READ OUR PRIVACY NOTICE & TERMS OF USE.

    Maverick's Cash-Flow Calculator

    DISCLAIMER
    OPEN

    This calculator is for recreational use only and is NOT financial or accounting software. There are a litany of variables that may be relevant to determining your individual tax obligations, financial performance and investment returns on a rental property that are NOT factored into this calculator. By using this calculator, you understand that the numbers herein are NOT specific projections of what your returns will actually be, and you agree that it is YOUR DUTY to consult with your own tax and financial professionals about the evaluation, risk assessment, realistic financial expectations, and actual tax obligations associated with any real estate investment. You also understand that ALL real estate investing involves risk, which buyer assumes 100%, and that no specific returns can ever be guaranteed by anyone.

    Top

    INSTRUCTIONS

    Click into any Investor INPUTS (THE ORANGE FIELDS) to modify.
    Click any field LABEL to view a definition.
    Click CALCULATE to update financial calculations on ALL TABS.
    Purchase
    Monthly Cashflow
    Tax Benefits
    Future Assumptions

    INSTRUCTIONS

    Click into any Investor INPUTS (THE ORANGE FIELDS) to modify.
    Click any field LABEL to view a definition.
    Click CALCULATE to update financial calculations on ALL TABS.
    Cash to Purchase
    Purchase Price
    $170,000
    Fair Market Value
    $170,000
    Down Payment Amount
    $34,000
    Depreciable Closing Costs
    $3,000
    Lender Fees / Points
    $3,000
    Total Cash Invested
    $40,000
    Total Equity at Purchase
    $34,000
    Morgage Calculation
    Loan Amount
    $136,000
    Monthly Mortgage Payment
    $730
    First Year Mortgage Principal Paid Down
    $2,006
    First Year Mortgage Interest Paid
    $6,754

    INSTRUCTIONS

    Click into any Investor INPUTS (THE ORANGE FIELDS) to modify.
    Click any field LABEL to view a definition.
    Click CALCULATE to update financial calculations on ALL TABS.
    First Year Monthly Cashflow
    Gross Scheduled Rent
    $1,454
    Vacancy Estimate
    $102
    Gross Operating Income
    $1,352
    Property Taxes
    $150
    Insurance
    $50
    Other Expense
    $0
    Owner-Paid Utilities / Landscaping
    $0
    Property Management Fee
    $145
    Maintenance Estimate
    $73
    Total Operating Expenses
    $418
    Net Operating Income (NOI)
    $934
    Mortgage Payment
    $730
    Cash Flow Before Taxes
    $204
    Gross Rent Multiplier (GRM)
    9.7
    Rent to Value Ratio (RV Ratio)
    0.9%
    Capitalization Rate (Cap Rate)
    6.6%
    Cash on Cash Return
    6.1%

    INSTRUCTIONS

    Click into any Investor INPUTS (THE ORANGE FIELDS) to modify.
    Click any field LABEL to view a definition.
    Click CALCULATE to update financial calculations on ALL TABS.
    Tax Benefits
    Value of (Non-Depreciable) Land
    $17,000
    Value of (Depreciable) Property Structure
    $153,000
    Depreciable "Cost Basis" at Purchase
    $156,000
    Annual Straight Line Depreciation of Cost Basis
    $5,673
    Annual Depreciation of Lender Fees / Costs
    $100
    First Year Total Depreciation
    $5,773
    First Year Taxable Income Before Depreciation
    $4,455
    First Year Taxable Income Offset by Depreciation
    $4,455
    First Year Remaining Taxable Income After Depreciation
    $0
    First Year Federal Income Taxes Owed on Rental Income
    $0
    First Year Tax Savings from Depreciation on Rental Income
    $1,426
    First Year Left Over Depreciation
    $1,318

    INSTRUCTIONS

    Click into any Investor INPUTS (THE ORANGE FIELDS) to modify.
    Click any field LABEL to view a definition.
    Click CALCULATE to update financial calculations on ALL TABS.
    (Swipe left or right to scroll horizontally)
    Annual Income
    Year 1Year 2Year 3Year 4Year 5Year 6Year 7Year 8Year 9Year 10Year 11Year 12Year 13Year 14Year 15Year 16Year 17Year 18Year 19Year 20Year 21Year 22Year 23Year 24Year 25Year 26Year 27Year 28Year 29Year 30
    Gross Scheduled Rent
    $17,448
    $17,797
    $18,153
    $18,516
    $18,886
    $19,264
    $19,649
    $20,042
    $20,443
    $20,852
    $21,269
    $21,694
    $22,128
    $22,571
    $23,022
    $23,483
    $23,952
    $24,431
    $24,920
    $25,418
    $25,927
    $26,445
    $26,974
    $27,514
    $28,064
    $28,625
    $29,198
    $29,782
    $30,377
    $30,985
    Vacancy Loss
    $1,221
    $1,246
    $1,271
    $1,296
    $1,322
    $1,348
    $1,375
    $1,403
    $1,431
    $1,460
    $1,489
    $1,519
    $1,549
    $1,580
    $1,612
    $1,644
    $1,677
    $1,710
    $1,744
    $1,779
    $1,815
    $1,851
    $1,888
    $1,926
    $1,964
    $2,004
    $2,044
    $2,085
    $2,126
    $2,169
    Gross Operating Income
    $16,227
    $16,551
    $16,882
    $17,220
    $17,564
    $17,916
    $18,274
    $18,639
    $19,012
    $19,392
    $19,780
    $20,176
    $20,579
    $20,991
    $21,411
    $21,839
    $22,276
    $22,721
    $23,176
    $23,639
    $24,112
    $24,594
    $25,086
    $25,588
    $26,100
    $26,622
    $27,154
    $27,697
    $28,251
    $28,816
    Annual Operating Expenses
    Year 1Year 2Year 3Year 4Year 5Year 6Year 7Year 8Year 9Year 10Year 11Year 12Year 13Year 14Year 15Year 16Year 17Year 18Year 19Year 20Year 21Year 22Year 23Year 24Year 25Year 26Year 27Year 28Year 29Year 30
    Property Taxes
    $1,800
    $1,800
    $1,800
    $1,800
    $1,800
    $1,800
    $1,800
    $1,800
    $1,800
    $1,800
    $1,800
    $1,800
    $1,800
    $1,800
    $1,800
    $1,800
    $1,800
    $1,800
    $1,800
    $1,800
    $1,800
    $1,800
    $1,800
    $1,800
    $1,800
    $1,800
    $1,800
    $1,800
    $1,800
    $1,800
    Insurance
    $600
    $600
    $600
    $600
    $600
    $600
    $600
    $600
    $600
    $600
    $600
    $600
    $600
    $600
    $600
    $600
    $600
    $600
    $600
    $600
    $600
    $600
    $600
    $600
    $600
    $600
    $600
    $600
    $600
    $600
    Maintenance Assumption
    $872
    $890
    $908
    $926
    $944
    $963
    $982
    $1,002
    $1,022
    $1,043
    $1,063
    $1,085
    $1,106
    $1,129
    $1,151
    $1,174
    $1,198
    $1,222
    $1,246
    $1,271
    $1,296
    $1,322
    $1,349
    $1,376
    $1,403
    $1,431
    $1,460
    $1,489
    $1,519
    $1,549
    Property Management
    $1,745
    $1,780
    $1,815
    $1,852
    $1,889
    $1,926
    $1,965
    $2,004
    $2,044
    $2,085
    $2,127
    $2,169
    $2,213
    $2,257
    $2,302
    $2,348
    $2,395
    $2,443
    $2,492
    $2,542
    $2,593
    $2,645
    $2,697
    $2,751
    $2,806
    $2,863
    $2,920
    $2,978
    $3,038
    $3,098
    Owner-Paid Utilities / Landscaping
    $0
    $0
    $0
    $0
    $0
    $0
    $0
    $0
    $0
    $0
    $0
    $0
    $0
    $0
    $0
    $0
    $0
    $0
    $0
    $0
    $0
    $0
    $0
    $0
    $0
    $0
    $0
    $0
    $0
    $0
    Other Expense
    $0
    $0
    $0
    $0
    $0
    $0
    $0
    $0
    $0
    $0
    $0
    $0
    $0
    $0
    $0
    $0
    $0
    $0
    $0
    $0
    $0
    $0
    $0
    $0
    $0
    $0
    $0
    $0
    $0
    $0
    Total Operating Expenses
    $5,017
    $5,070
    $5,123
    $5,177
    $5,233
    $5,290
    $5,347
    $5,406
    $5,466
    $5,528
    $5,590
    $5,654
    $5,719
    $5,786
    $5,853
    $5,922
    $5,993
    $6,065
    $6,138
    $6,213
    $6,289
    $6,367
    $6,446
    $6,527
    $6,610
    $6,694
    $6,780
    $6,867
    $6,957
    $7,048
    Annual Debt Service
    Year 1Year 2Year 3Year 4Year 5Year 6Year 7Year 8Year 9Year 10Year 11Year 12Year 13Year 14Year 15Year 16Year 17Year 18Year 19Year 20Year 21Year 22Year 23Year 24Year 25Year 26Year 27Year 28Year 29Year 30
    Debt Service
    $8,761
    $8,761
    $8,761
    $8,761
    $8,761
    $8,761
    $8,761
    $8,761
    $8,761
    $8,761
    $8,761
    $8,761
    $8,761
    $8,761
    $8,761
    $8,761
    $8,761
    $8,761
    $8,761
    $8,761
    $8,761
    $8,761
    $8,761
    $8,761
    $8,761
    $8,761
    $8,761
    $8,761
    $8,761
    $8,761
    Mortgage Balance at Year End
    $133,994
    $131,884
    $129,667
    $127,337
    $124,887
    $122,312
    $119,605
    $116,760
    $113,769
    $110,625
    $107,320
    $103,847
    $100,195
    $96,357
    $92,322
    $88,081
    $83,623
    $78,937
    $74,011
    $68,833
    $63,390
    $57,668
    $51,654
    $45,333
    $38,687
    $31,702
    $24,360
    $16,641
    $8,528
    -
    Debt Service Coverage Ratio
    1.28%
    1.31%
    1.34%
    1.37%
    1.41%
    1.44%
    1.48%
    1.51%
    1.55%
    1.58%
    1.62%
    1.66%
    1.7%
    1.74%
    1.78%
    1.82%
    1.86%
    1.9%
    1.94%
    1.99%
    2.03%
    2.08%
    2.13%
    2.18%
    2.22%
    2.27%
    2.33%
    2.38%
    2.43%
    2.48%
    Annual Capital Improvements
    Year 1Year 2Year 3Year 4Year 5Year 6Year 7Year 8Year 9Year 10Year 11Year 12Year 13Year 14Year 15Year 16Year 17Year 18Year 19Year 20Year 21Year 22Year 23Year 24Year 25Year 26Year 27Year 28Year 29Year 30
    Capital Improvements
    $0
    $0
    $0
    $0
    $0
    $0
    $0
    $0
    $0
    $0
    $0
    $0
    $0
    $0
    $0
    $0
    $0
    $0
    $0
    $0
    $0
    $0
    $0
    $0
    $0
    $0
    $0
    $0
    $0
    $0
    Annual Cash Flow Analysis
    Year 1Year 2Year 3Year 4Year 5Year 6Year 7Year 8Year 9Year 10Year 11Year 12Year 13Year 14Year 15Year 16Year 17Year 18Year 19Year 20Year 21Year 22Year 23Year 24Year 25Year 26Year 27Year 28Year 29Year 30
    Net Operating Income
    $11,209
    $11,482
    $11,759
    $12,042
    $12,331
    $12,626
    $12,926
    $13,233
    $13,546
    $13,865
    $14,190
    $14,522
    $14,860
    $15,205
    $15,557
    $15,917
    $16,283
    $16,657
    $17,038
    $17,426
    $17,823
    $18,227
    $18,640
    $19,061
    $19,490
    $19,928
    $20,374
    $20,830
    $21,294
    $21,768
    Capitalization Rate
    6.6%
    6.8%
    6.9%
    7.1%
    7.3%
    7.4%
    7.6%
    7.8%
    8%
    8.2%
    8.3%
    8.5%
    8.7%
    8.9%
    9.2%
    9.4%
    9.6%
    9.8%
    10%
    10.3%
    10.5%
    10.7%
    11%
    11.2%
    11.5%
    11.7%
    12%
    12.3%
    12.5%
    12.8%
    Cash Flow Before Taxes
    $2,449
    $2,721
    $2,998
    $3,282
    $3,570
    $3,865
    $4,166
    $4,472
    $4,785
    $5,104
    $5,429
    $5,761
    $6,099
    $6,444
    $6,796
    $7,156
    $7,522
    $7,896
    $8,277
    $8,665
    $9,062
    $9,466
    $9,879
    $10,300
    $10,729
    $11,167
    $11,613
    $12,069
    $12,533
    $13,007
    Cash on Cash Return
    6.1%
    6.8%
    7.5%
    8.2%
    8.9%
    9.7%
    10.4%
    11.2%
    12%
    12.8%
    13.6%
    14.4%
    15.2%
    16.1%
    17%
    17.9%
    18.8%
    19.7%
    20.7%
    21.7%
    22.7%
    23.7%
    24.7%
    25.7%
    26.8%
    27.9%
    29%
    30.2%
    31.3%
    32.5%
    Annual Equity Accumulation
    Year 1Year 2Year 3Year 4Year 5Year 6Year 7Year 8Year 9Year 10Year 11Year 12Year 13Year 14Year 15Year 16Year 17Year 18Year 19Year 20Year 21Year 22Year 23Year 24Year 25Year 26Year 27Year 28Year 29Year 30
    Property Appreciation
    $6,800
    $7,072
    $7,355
    $7,649
    $7,955
    $8,273
    $8,604
    $8,948
    $9,306
    $9,679
    $10,066
    $10,468
    $10,887
    $11,322
    $11,775
    $12,246
    $12,736
    $13,246
    $13,776
    $14,327
    $14,900
    $15,496
    $16,115
    $16,760
    $17,430
    $18,128
    $18,853
    $19,607
    $20,391
    $21,207
    Mortgage Principal Pay Down
    $2,006
    $2,109
    $2,217
    $2,330
    $2,450
    $2,575
    $2,707
    $2,845
    $2,991
    $3,144
    $3,305
    $3,474
    $3,652
    $3,838
    $4,035
    $4,241
    $4,458
    $4,686
    $4,926
    $5,178
    $5,443
    $5,721
    $6,014
    $6,322
    $6,645
    $6,985
    $7,343
    $7,718
    $8,113
    $8,528
    Total Equity Growth
    $8,806
    $9,181
    $9,572
    $9,980
    $10,405
    $10,848
    $11,311
    $11,794
    $12,297
    $12,822
    $13,370
    $13,942
    $14,539
    $15,161
    $15,810
    $16,488
    $17,194
    $17,932
    $18,702
    $19,505
    $20,343
    $21,217
    $22,130
    $23,082
    $24,076
    $25,113
    $26,195
    $27,325
    $28,504
    $29,735
    Annual Tax Savings From Depreciation
    Year 1Year 2Year 3Year 4Year 5Year 6Year 7Year 8Year 9Year 10Year 11Year 12Year 13Year 14Year 15Year 16Year 17Year 18Year 19Year 20Year 21Year 22Year 23Year 24Year 25Year 26Year 27Year 28Year 29Year 30
    Straight Line Depreciation of Cost Basis
    $5,773
    $5,773
    $5,773
    $5,773
    $5,773
    $5,773
    $5,773
    $5,773
    $5,773
    $5,773
    $5,773
    $5,773
    $5,773
    $5,773
    $5,773
    $5,773
    $5,773
    $5,773
    $5,773
    $5,773
    $5,773
    $5,773
    $5,773
    $5,773
    $5,773
    $5,773
    $5,773
    $2,886
    $0
    $0
    Straight Line Depreciaiton of Lender Fees / Points
    $100
    $100
    $100
    $100
    $100
    $100
    $100
    $100
    $100
    $100
    $100
    $100
    $100
    $100
    $100
    $100
    $100
    $100
    $100
    $100
    $100
    $100
    $100
    $100
    $100
    $100
    $100
    $100
    $100
    $100
    Total Straight Line Depreciation
    $5,873
    $5,873
    $5,873
    $5,873
    $5,873
    $5,873
    $5,873
    $5,873
    $5,873
    $5,873
    $5,873
    $5,873
    $5,873
    $5,873
    $5,873
    $5,873
    $5,873
    $5,873
    $5,873
    $5,873
    $5,873
    $5,873
    $5,873
    $5,873
    $5,873
    $5,873
    $5,873
    $2,986
    $100
    $100
    Taxable Income Before Depreciation
    $4,455
    $4,830
    $5,215
    $5,612
    $6,020
    $6,440
    $6,872
    $7,317
    $7,776
    $8,247
    $8,734
    $9,234
    $9,751
    $10,283
    $10,831
    $11,397
    $11,980
    $12,582
    $13,203
    $13,843
    $14,505
    $15,188
    $15,893
    $16,622
    $17,374
    $18,152
    $18,956
    $19,787
    $20,647
    $21,536
    Carry Forward Loss From Depreciation
    $1,418
    $2,461
    $3,118
    $3,379
    $3,231
    $2,664
    $1,664
    $220
    $0
    $0
    $0
    $0
    $0
    $0
    $0
    $0
    $0
    $0
    $0
    $0
    $0
    $0
    $0
    $0
    $0
    $0
    $0
    $0
    $0
    $0
    Taxable Income Offset by Depreciation
    $4,455
    $4,830
    $5,215
    $5,612
    $6,020
    $6,440
    $6,872
    $7,317
    $6,093
    $5,873
    $5,873
    $5,873
    $5,873
    $5,873
    $5,873
    $5,873
    $5,873
    $5,873
    $5,873
    $5,873
    $5,873
    $5,873
    $5,873
    $5,873
    $5,873
    $5,873
    $5,873
    $2,986
    $100
    $100
    Remaining Taxable Income After Depreciation
    $0
    $0
    $0
    $0
    $0
    $0
    $0
    $0
    $1,683
    $2,375
    $2,861
    $3,362
    $3,878
    $4,410
    $4,958
    $5,524
    $6,107
    $6,709
    $7,330
    $7,971
    $8,632
    $9,315
    $10,020
    $10,749
    $11,501
    $12,279
    $13,083
    $16,801
    $20,547
    $21,436
    Federal Income Tax Owed on Rental Income
    $0
    $0
    $0
    $0
    $0
    $0
    $0
    $0
    $539
    $760
    $915
    $1,076
    $1,241
    $1,411
    $1,587
    $1,768
    $1,954
    $2,147
    $2,346
    $2,551
    $2,762
    $2,981
    $3,207
    $3,440
    $3,680
    $3,929
    $4,187
    $5,376
    $6,575
    $6,859
    Tax Savings from Depreciation
    $1,426
    $1,546
    $1,669
    $1,796
    $1,926
    $2,061
    $2,199
    $2,342
    $1,950
    $1,879
    $1,879
    $1,879
    $1,879
    $1,879
    $1,879
    $1,879
    $1,879
    $1,879
    $1,879
    $1,879
    $1,879
    $1,879
    $1,879
    $1,879
    $1,879
    $1,879
    $1,879
    $956
    $32
    $32
    Cash Flow After Taxes
    $2,449
    $2,721
    $2,998
    $3,282
    $3,570
    $3,865
    $4,166
    $4,472
    $4,246
    $4,344
    $4,513
    $4,685
    $4,858
    $5,033
    $5,210
    $5,388
    $5,568
    $5,749
    $5,931
    $6,115
    $6,300
    $6,486
    $6,672
    $6,860
    $7,049
    $7,237
    $7,427
    $6,693
    $5,959
    $6,148
    Performance Over Time
    Year 1Year 2Year 3Year 4Year 5Year 6Year 7Year 8Year 9Year 10Year 11Year 12Year 13Year 14Year 15Year 16Year 17Year 18Year 19Year 20Year 21Year 22Year 23Year 24Year 25Year 26Year 27Year 28Year 29Year 30
    Fair Market Property Value at Year End
    $176,800
    $183,872
    $191,227
    $198,876
    $206,831
    $215,104
    $223,708
    $232,657
    $241,963
    $251,642
    $261,707
    $272,175
    $283,062
    $294,385
    $306,160
    $318,407
    $331,143
    $344,389
    $358,164
    $372,491
    $387,391
    $402,886
    $419,002
    $435,762
    $453,192
    $471,320
    $490,173
    $509,780
    $530,171
    $551,378
    Cumulative Appreciation
    $6,800
    $13,872
    $21,227
    $28,876
    $36,831
    $45,104
    $53,708
    $62,657
    $71,963
    $81,642
    $91,707
    $102,175
    $113,062
    $124,385
    $136,160
    $148,407
    $161,143
    $174,389
    $188,164
    $202,491
    $217,391
    $232,886
    $249,002
    $265,762
    $283,192
    $301,320
    $320,173
    $339,780
    $360,171
    $381,378
    Cumulative Mortgage Principal Paydown
    $2,006
    $4,116
    $6,333
    $8,663
    $11,113
    $13,688
    $16,395
    $19,240
    $22,231
    $25,375
    $28,680
    $32,153
    $35,805
    $39,643
    $43,678
    $47,919
    $52,377
    $57,063
    $61,989
    $67,167
    $72,610
    $78,332
    $84,346
    $90,667
    $97,313
    $104,298
    $111,640
    $119,359
    $127,472
    $136,000
    Total Cumulative Equity
    $42,806
    $51,988
    $61,560
    $71,539
    $81,944
    $92,792
    $104,103
    $115,897
    $128,194
    $141,016
    $154,387
    $168,329
    $182,867
    $198,028
    $213,838
    $230,326
    $247,520
    $265,452
    $284,154
    $303,658
    $324,001
    $345,218
    $367,347
    $390,429
    $414,505
    $439,618
    $465,813
    $493,138
    $521,643
    $551,378
    Cumulative Cash Flow Before Taxes
    $2,449
    $5,169
    $8,168
    $11,449
    $15,019
    $18,884
    $23,050
    $27,522
    $32,307
    $37,410
    $42,839
    $48,600
    $54,699
    $61,143
    $67,940
    $75,095
    $82,617
    $90,513
    $98,790
    $107,455
    $116,517
    $125,983
    $135,862
    $146,162
    $156,891
    $168,058
    $179,671
    $191,740
    $204,274
    $217,281
    Cumulative Tax Savings From Depreciation
    $1,426
    $2,971
    $4,640
    $6,436
    $8,362
    $10,423
    $12,622
    $14,964
    $16,913
    $18,793
    $20,672
    $22,551
    $24,431
    $26,310
    $28,189
    $30,068
    $31,948
    $33,827
    $35,706
    $37,585
    $39,465
    $41,344
    $43,223
    $45,103
    $46,982
    $48,861
    $50,740
    $51,696
    $51,728
    $51,760
    Cumulative Cash Flow After Taxes
    $2,449
    $5,169
    $8,168
    $11,449
    $15,019
    $18,884
    $23,050
    $27,522
    $31,768
    $36,112
    $40,625
    $45,310
    $50,168
    $55,201
    $60,411
    $65,799
    $71,367
    $77,115
    $83,047
    $89,161
    $95,461
    $101,947
    $108,619
    $115,479
    $122,528
    $129,765
    $137,192
    $143,885
    $149,843
    $155,991
    Total Net Profit if Sold
    -
    $2,447
    $14,429
    $27,078
    $40,417
    $54,468
    $69,256
    $84,806
    $100,605
    $116,997
    $134,075
    $151,865
    $170,391
    $189,679
    $209,757
    $230,652
    $252,395
    $275,016
    $298,547
    $323,020
    $348,471
    $374,934
    $402,446
    $431,048
    $460,777
    $491,677
    $523,791
    $556,240
    $589,072
    $623,258
    Total Return on Investment if Sold
    -
    6.12%
    36.07%
    67.7%
    101.04%
    136.17%
    173.14%
    212.02%
    251.51%
    292.49%
    335.19%
    379.66%
    425.98%
    474.2%
    524.39%
    576.63%
    630.99%
    687.54%
    746.37%
    807.55%
    871.18%
    937.33%
    1006.12%
    1077.62%
    1151.94%
    1229.19%
    1309.48%
    1390.6%
    1472.68%
    1558.15%
    Before-Tax Return on Investment if Held
    28.1%
    29.8%
    31.4%
    33.2%
    34.9%
    36.8%
    38.7%
    40.7%
    42.7%
    44.8%
    47%
    49.3%
    51.6%
    54%
    56.5%
    59.1%
    61.8%
    64.6%
    67.4%
    70.4%
    73.5%
    76.7%
    80%
    83.5%
    87%
    90.7%
    94.5%
    98.5%
    102.6%
    106.9%
    After-Tax Return on Investment if Held
    28.1%
    29.8%
    31.4%
    33.2%
    34.9%
    36.8%
    38.7%
    40.7%
    41.4%
    42.9%
    44.7%
    46.6%
    48.5%
    50.5%
    52.5%
    54.7%
    56.9%
    59.2%
    61.6%
    64%
    66.6%
    69.3%
    72%
    74.9%
    77.8%
    80.9%
    84.1%
    85%
    86.2%
    89.7%
    Internal Rate of Return (IRR)
    -
    3.1%
    11.4%
    14.9%
    16.4%
    17.2%
    17.5%
    17.5%
    17.5%
    17.3%
    17.1%
    16.9%
    16.7%
    16.5%
    16.3%
    16.2%
    16%
    15.8%
    15.6%
    15.5%
    15.3%
    15.1%
    15%
    14.9%
    14.8%
    14.6%
    14.5%
    14.4%
    14.3%
    14.2%