Own Cash-Flowing Rental Properties in the Best U.S. Markets From Anywhere!

Search
Close this search box.

Welcome to Charlotte!

ABOUT Charlotte

The Charlotte, North Carolina MSA is one of the nation’s most explosive growth markets with home prices appreciating over 78% in the last 5 years! (Source: FHFA.gov). Known as “The Financial Capital of the South”, Charlotte is the biggest financial center in the U.S. after New York City, and it’s home to both Bank of America and Wells Fargo. Oh, and it’s the Pimento cheese capital of the world too. 🙂 Charlotte is the home of 9 Fortune 500 Companies and 18 Fortune 1,000 companies with job growth booming and low unemployment. (Source: BLS.gov) Charlotte also has lower than average home prices, lower than average cost of living, but an incredible quality of life. This perfect storm provides a uniquely investor-advantaged real estate market for buying and holding rental properties.

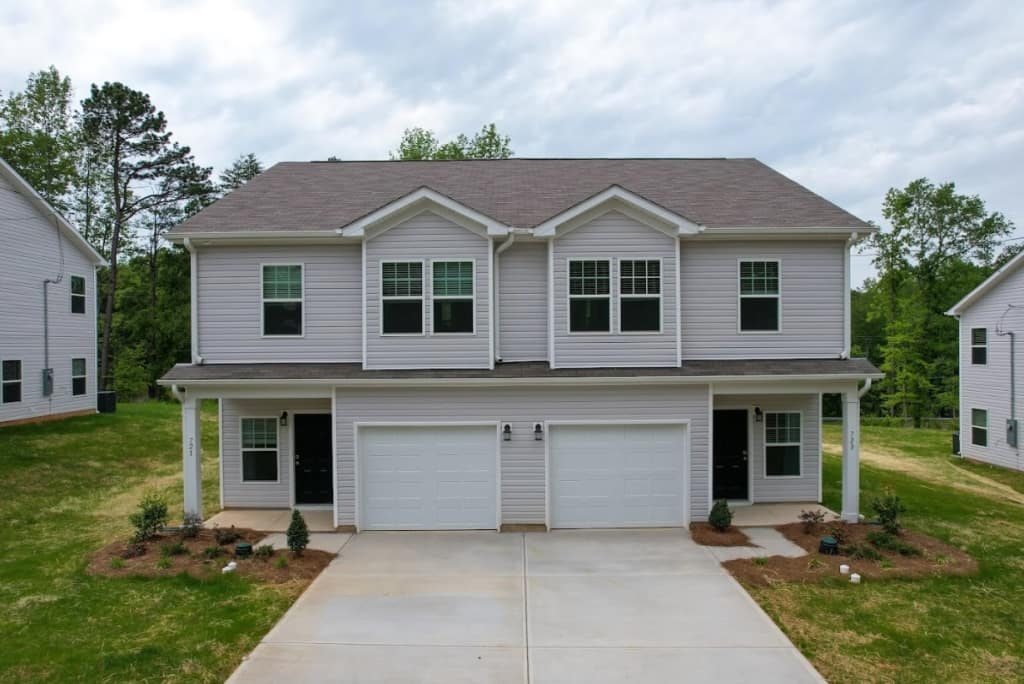
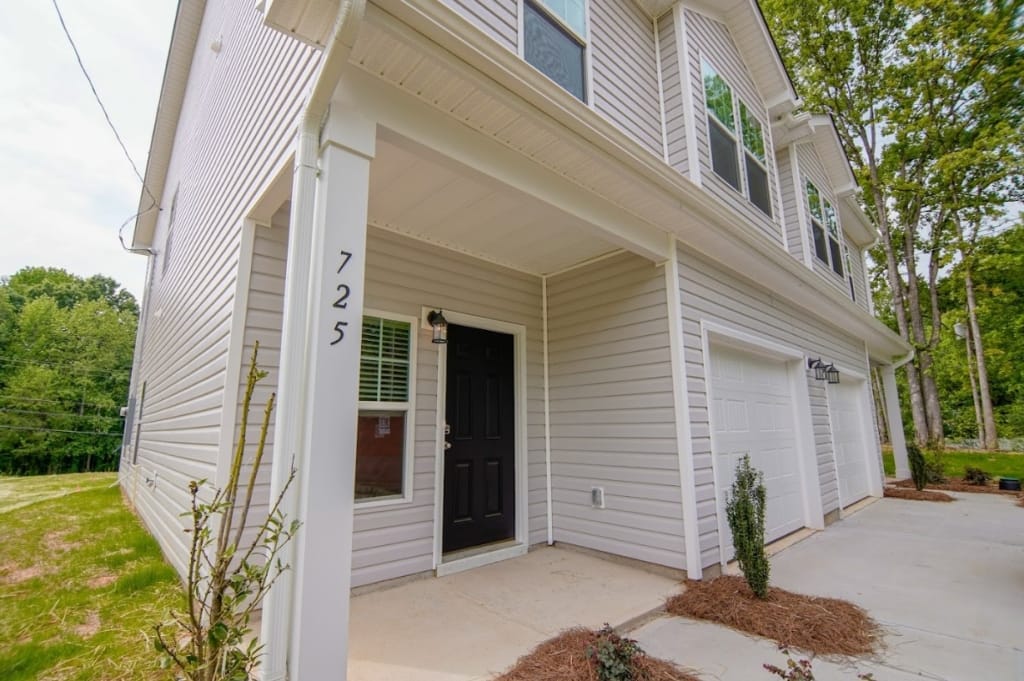
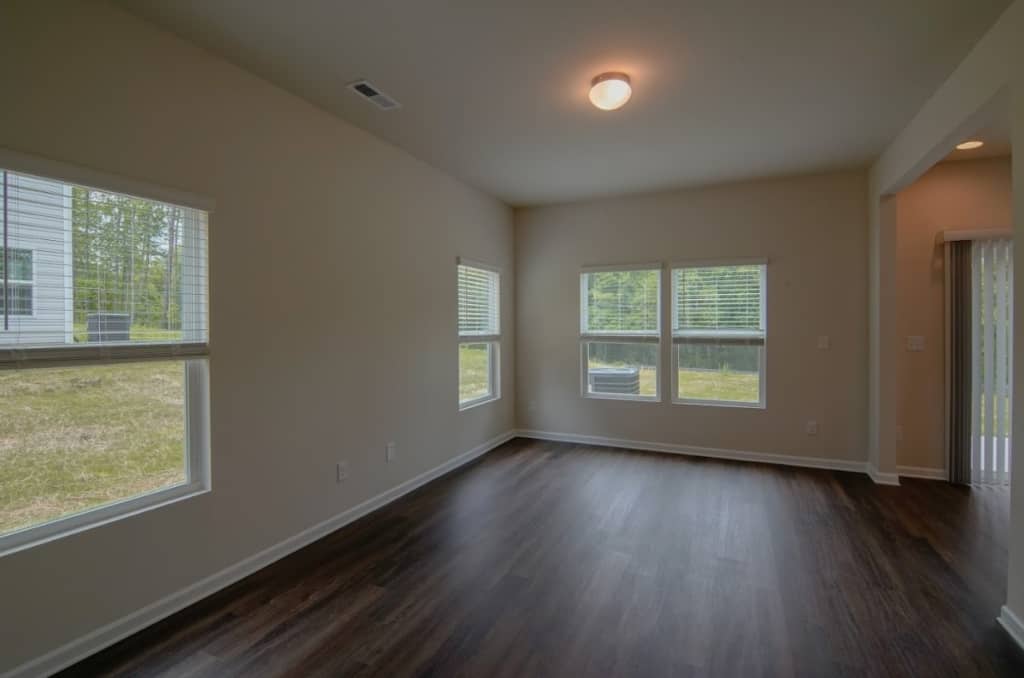
Lackey Street Ext Kings Mountain, NC

RESERVE THIS PROPERTY

OFFERED BY THE SELLER

  • 2 years of free property management (when using the preferred PM company) on all properties.

Snapshot Financials

Price:
$ 549900
Rent:
$ 3750 / mo
Taxes:

Estimated Property Taxes

$ 320
Insurance:

Estimated Insurance

$ 1200
HOA Fee:

Home Owners Association Fee

$ 0
PM Fee:

Property Management Fee

$ 187.5
Other:
$ 0
Other:
$ 0
Vacancy:

Based on 5%

$ 187.5
Repairs:

Based on 4%

$ 150
Total:

Total Monthly Expenses

$ 945
NOI:

Monthly Net Operating Income ('NOI') = Monthly Gross Scheduled Rent - Monthly Operating Expenses - 5% Maintenance Estimate - 7% Vacancy Estimates. NOI does not take into account any financing that you may be using. The NOI is always an 'estimate' and can never be guaranteed because it includes the non-fixed variables of 'maintenance' and 'vacancy' which vary over time.

$ 2805 / mo
Cap Rate:

Capitalization Rate ('Cap Rate') = Annual Net Operating Income / Purchase Price. Cap Rate does not take into account any financing you may be using nor any closing costs you may be paying.

6.12 %
GRM:

Gross Rent Multiplier ('GRM') = Purchase Price / Annual Gross Scheduled Rent. GRM is only a price to rent ratio and does not take into account any operating expenses, financing, closing cost payments or maintenance and vacancy assumptions. And remember, GRM is like a golf score, the lower the better.
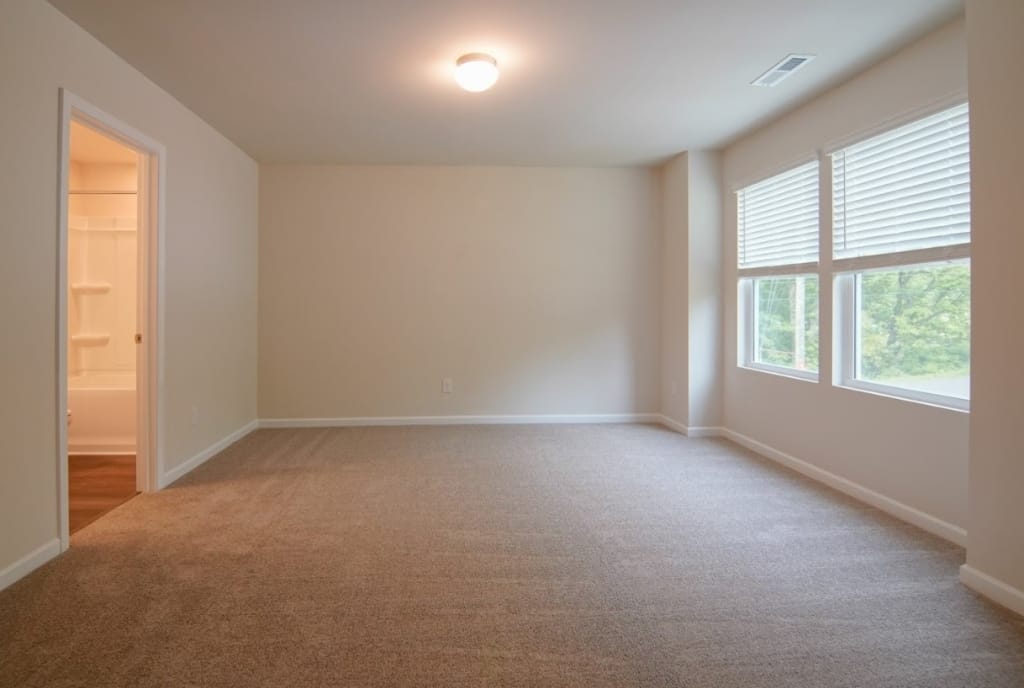
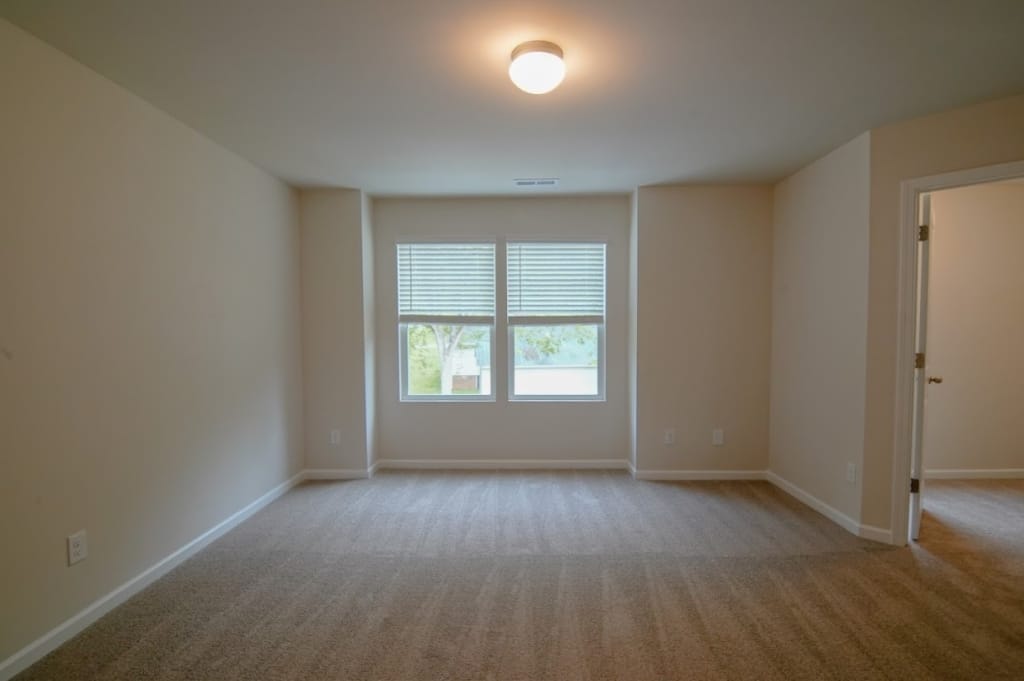
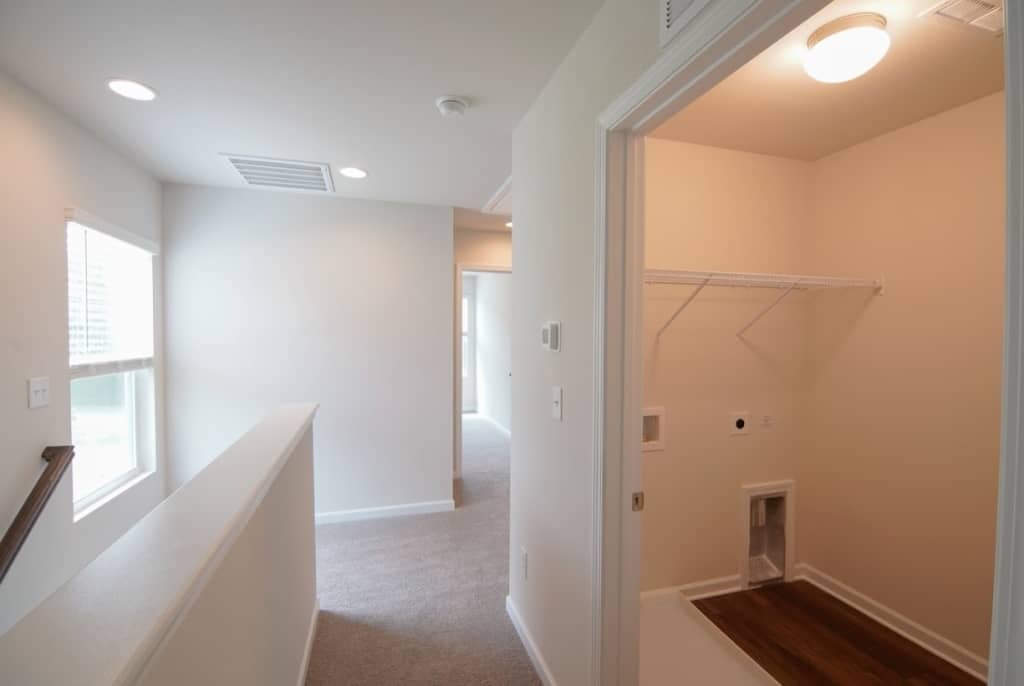
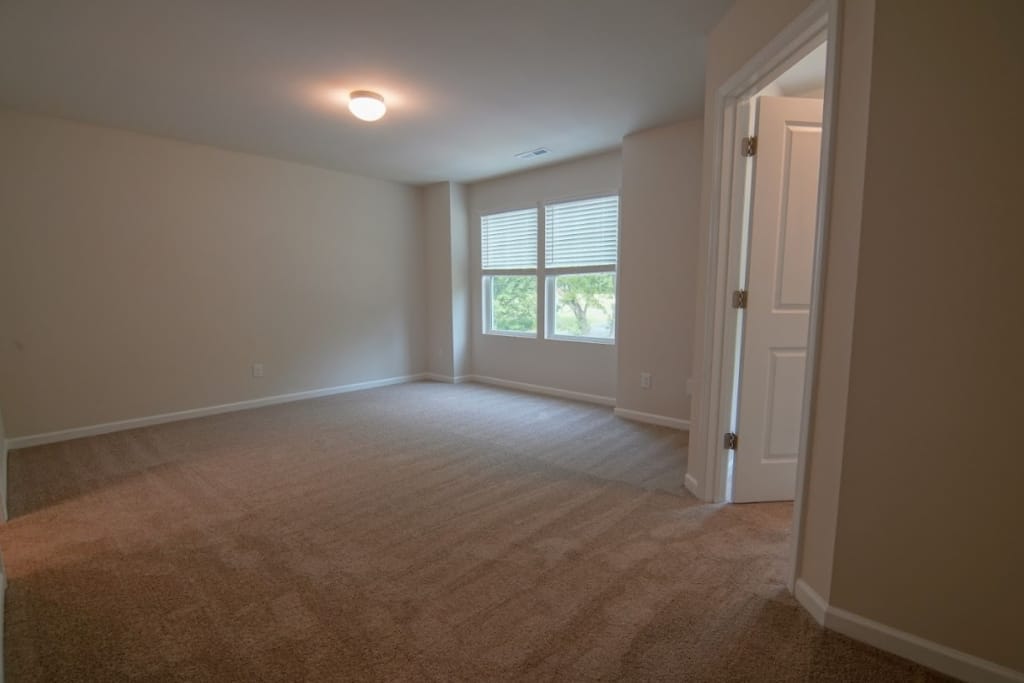
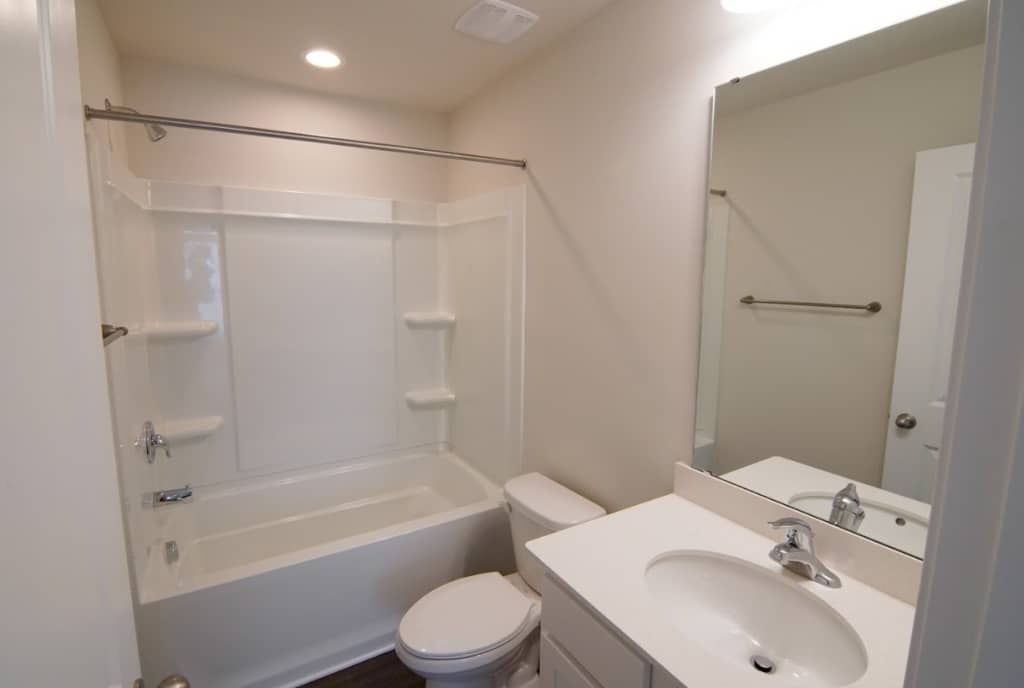
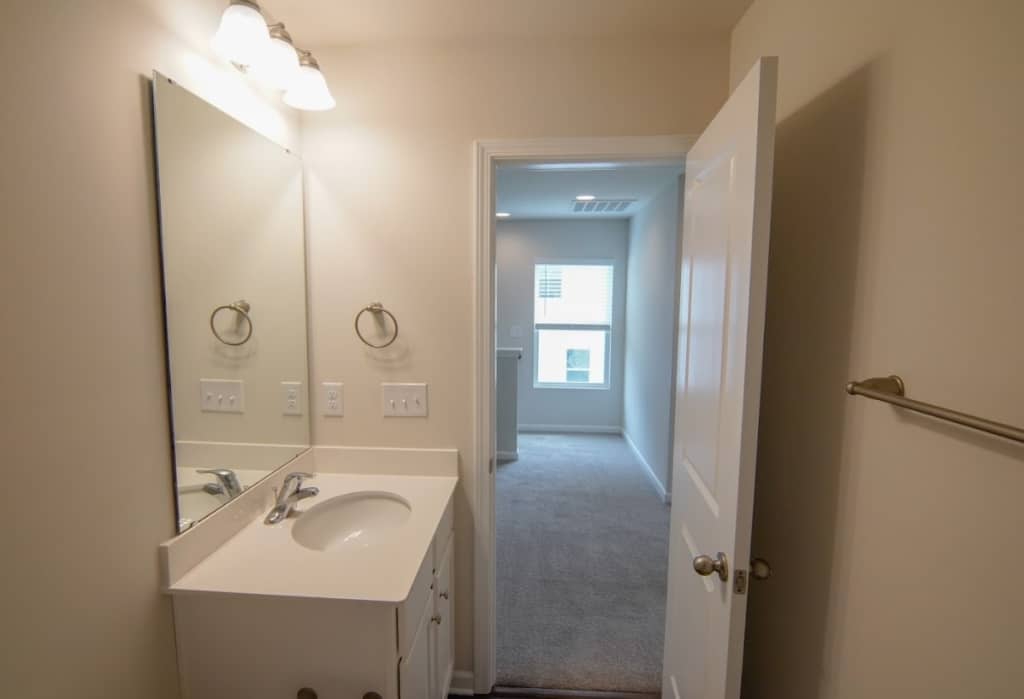
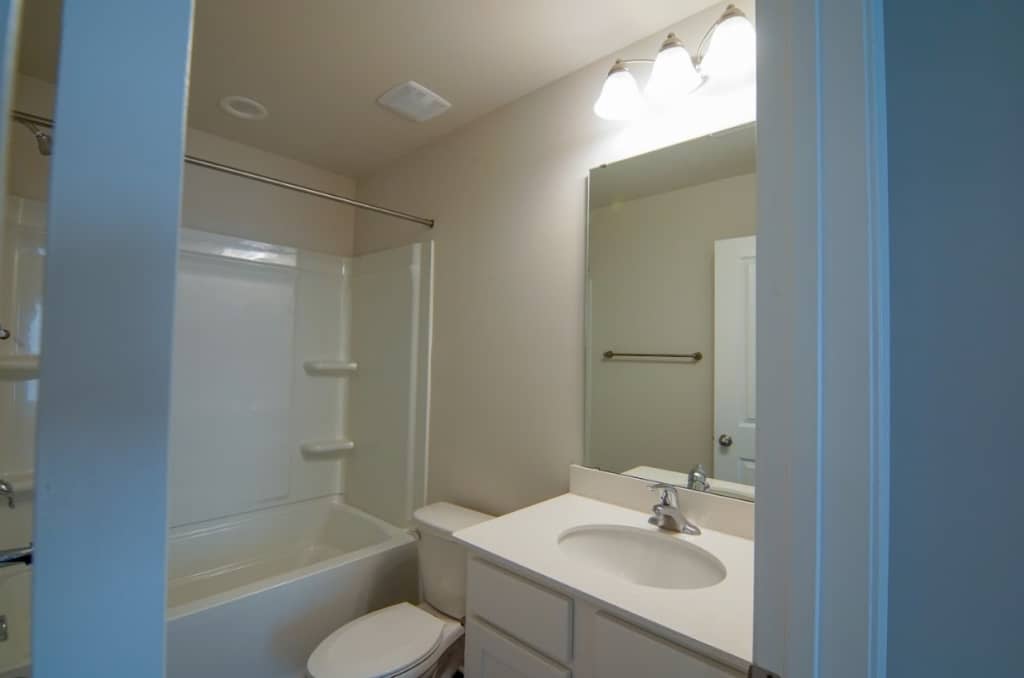
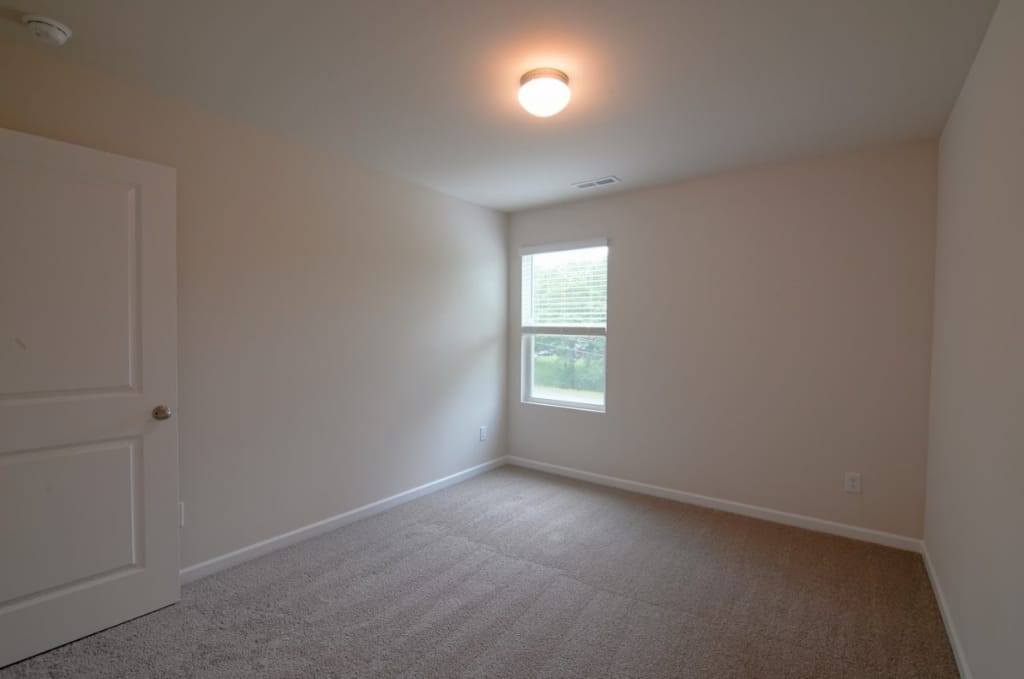
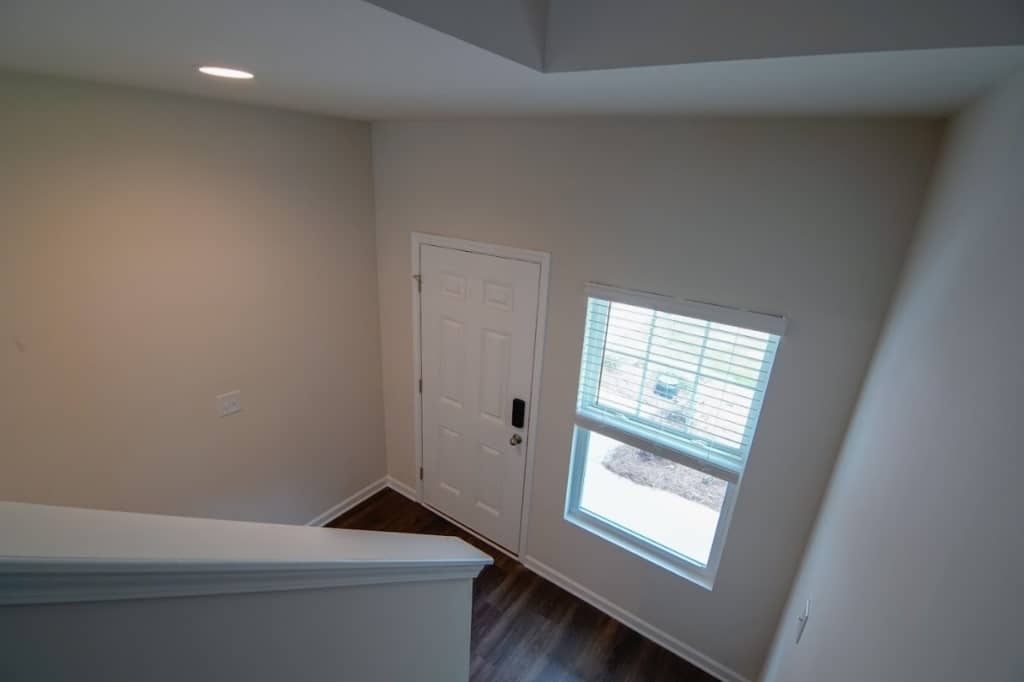
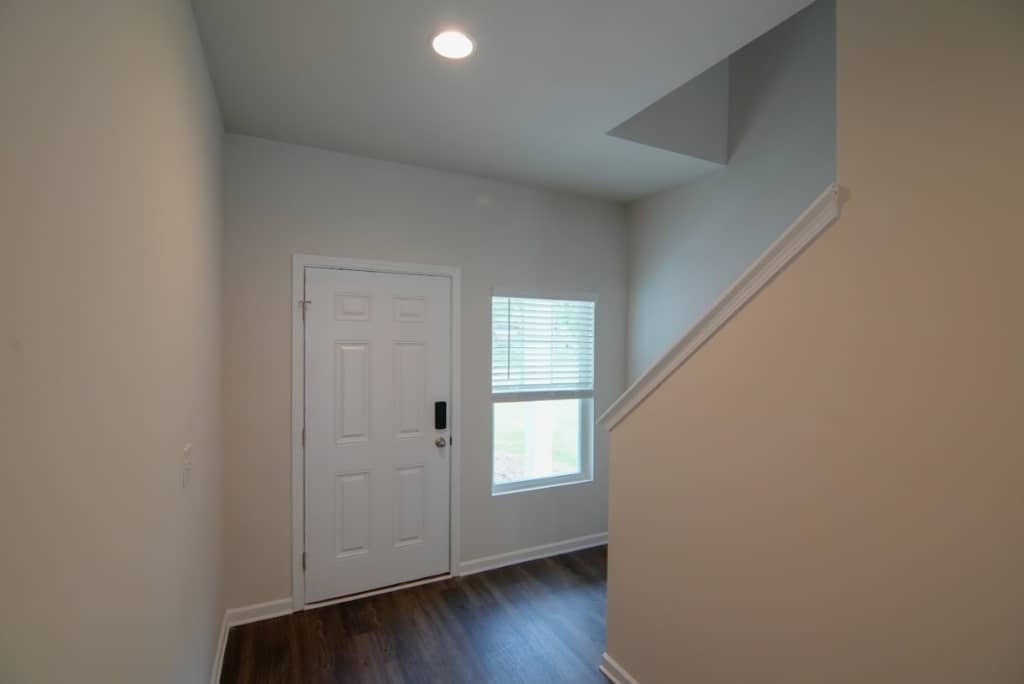
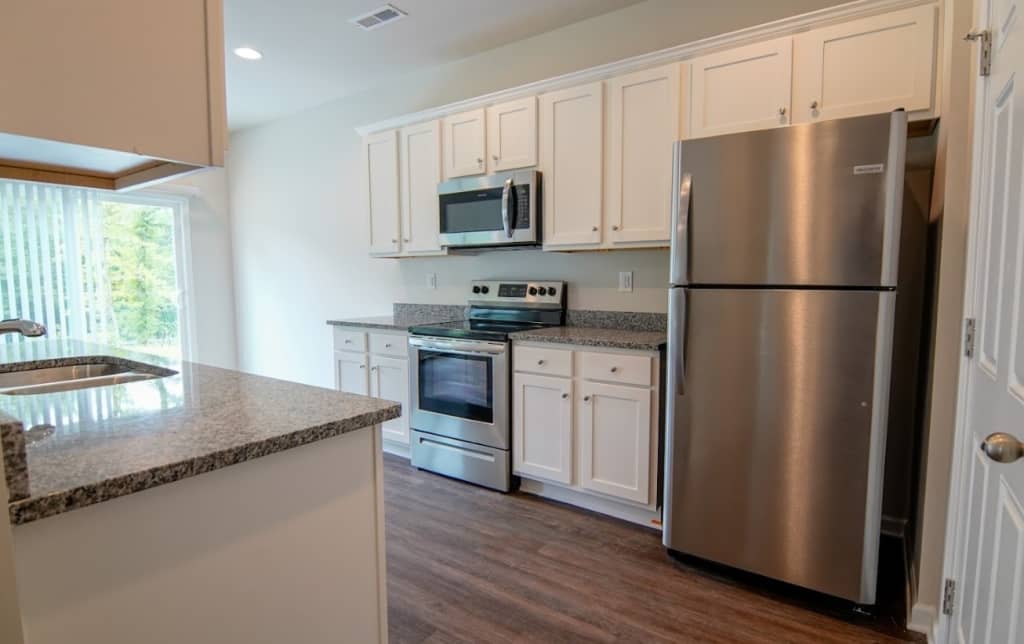
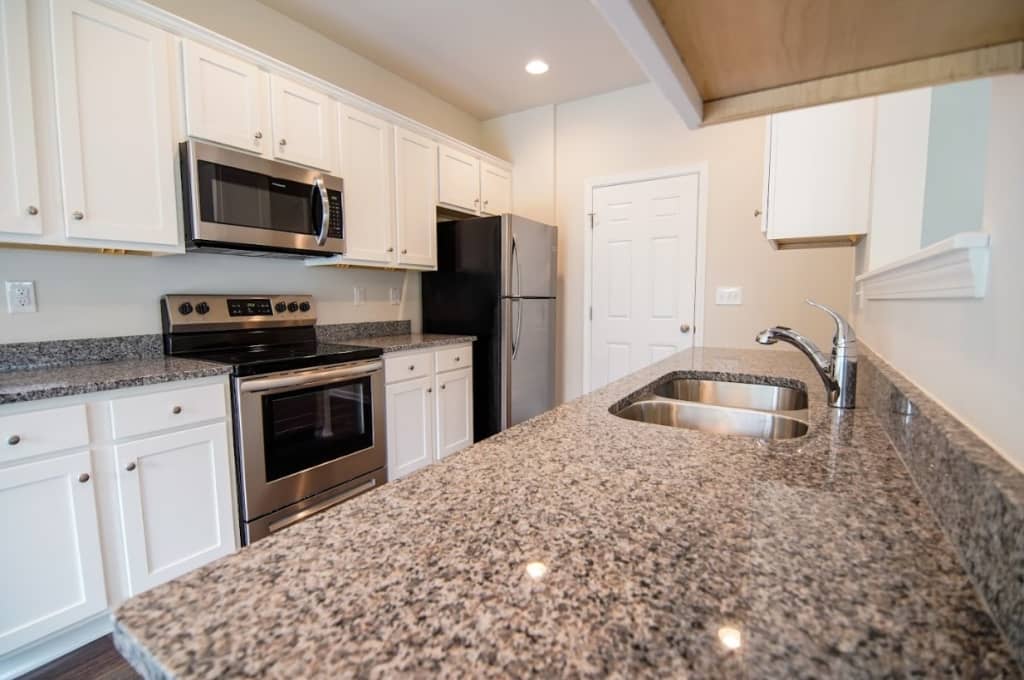
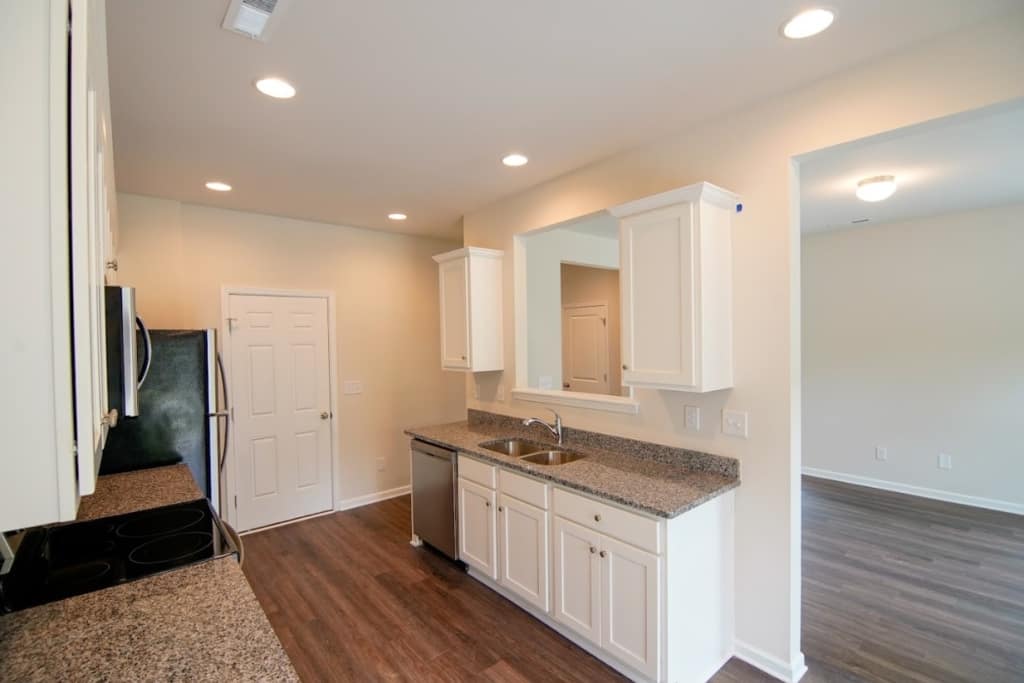
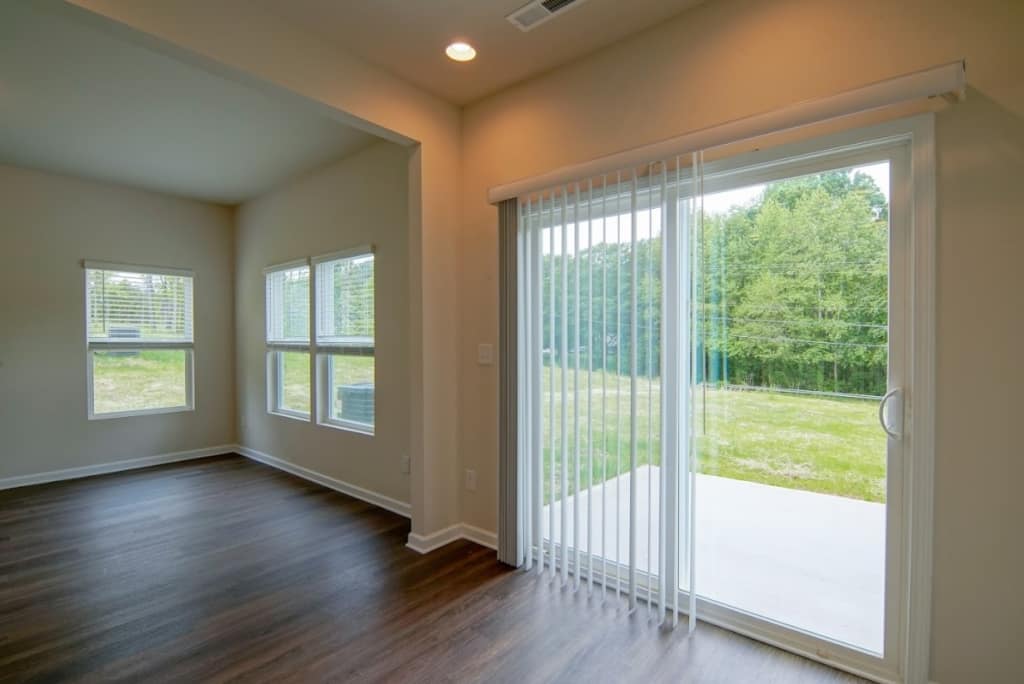
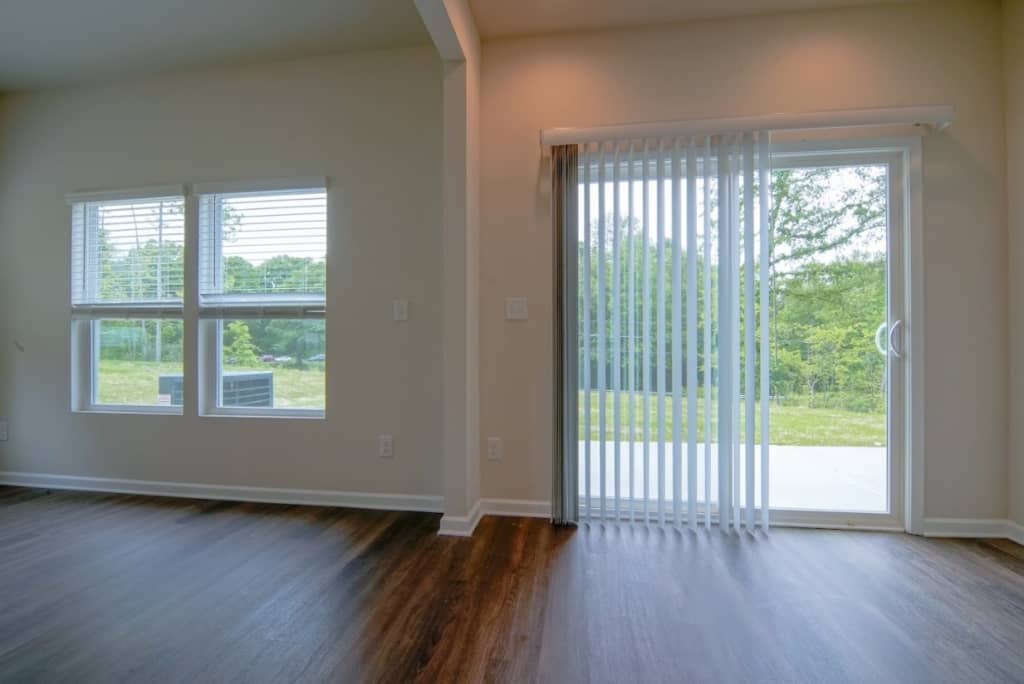
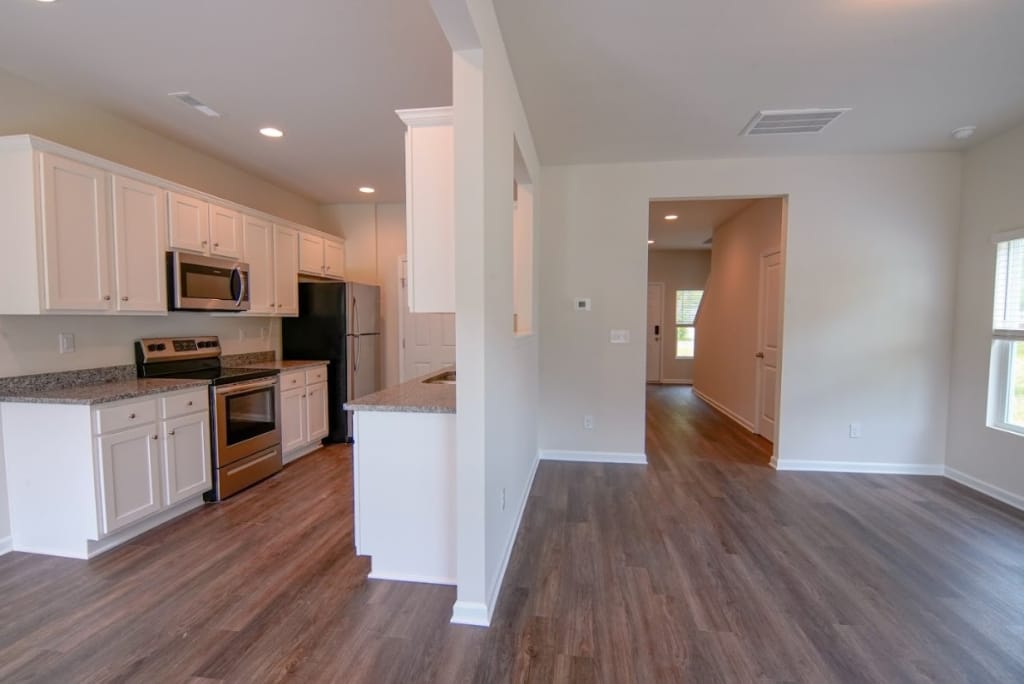
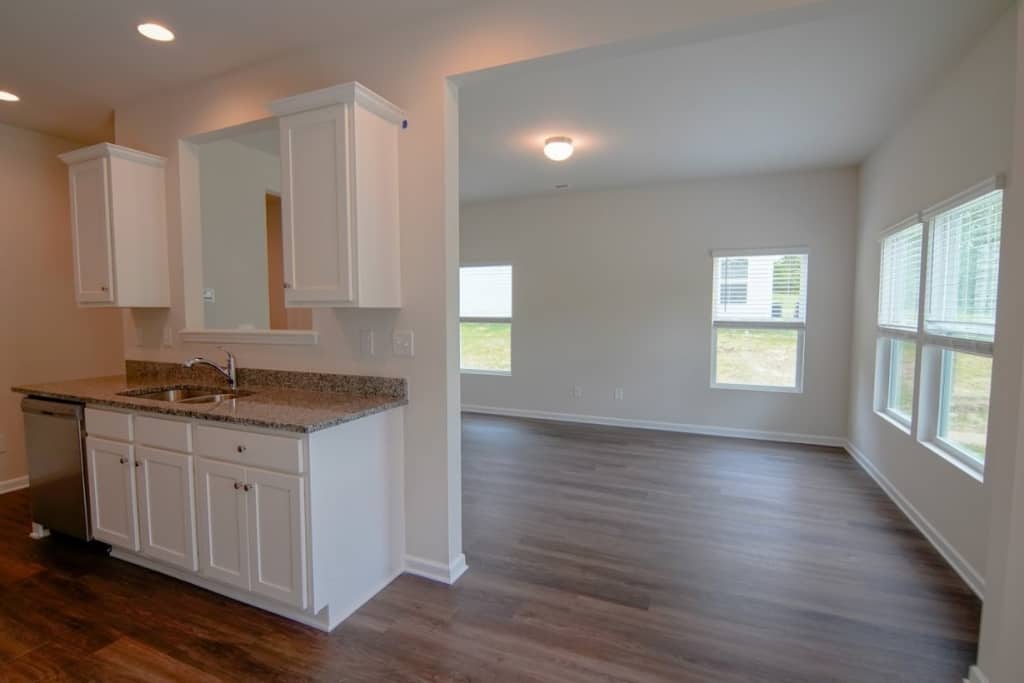
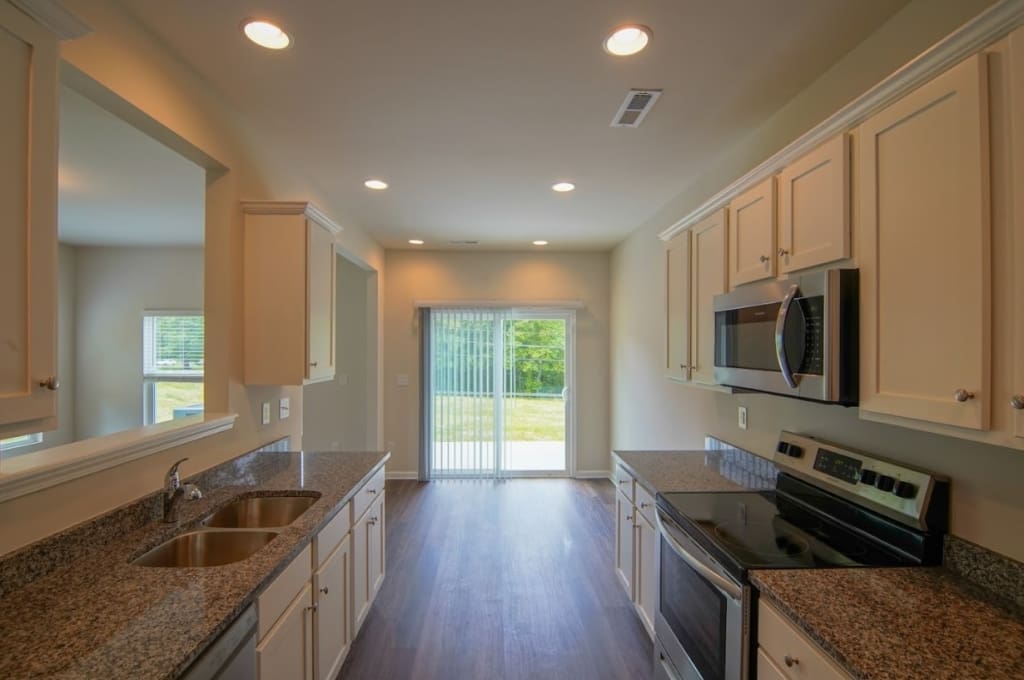
12.22

Property Features

Type:
Duplex
Condition:
New Construction
Rental Status:
Currently Rented
Year Built:
2023
Bedrooms:
6
Bathrooms:
4.0
Floor Area:
2892 Sq Ft
Lot Size:
n/a
Stories:
2 Stories
Basement:
Unknown
Parking:
2 Car Garage
RESERVE THIS PROPERTY

Seller's Additional Notes

Note: Both Sides are Leased!  
Seller is offering 2% seller-paid closing costs.

Charlotte Highlights

Charlotte Properties:

  • New Construction Single Family Rental Properties and Duplexes
  • Established Communities
  • Granite Countertops, Stainless Steel Appliances and a 2-10 Builder Warranty
  • 6%+ Average Cap Rate

Charlotte Market:

  • 7.6%+ Home Price Appreciation last year in the Charlotte MSAs (Source: FHFA.gov)
  • 78% Home Price Appreciation in the Last 5 Years (Source: FHFA)
  • 20% Population Growth in the Last Decade (Source: U.S. Census)
  • Home of 9 Fortune 500 Companies including Bank of America and Wells Fargo

Similar
Properties

Maverick Property Vault

$2827 Net Operating Income
$1523 Net Operating Income
$2616 Net Operating Income
$2732 Net Operating Income
$1820 Net Operating Income

More Maverick Markets

Subscribe

    GET Access TO Private buying opportunities for TURNKEY Rental properies & EDUCATIONAL RESOURCES. READ OUR PRIVACY NOTICE & TERMS OF USE.

    Maverick's Cash-Flow Calculator

    DISCLAIMER
    OPEN

    This calculator is for recreational use only and is NOT financial or accounting software. There are a litany of variables that may be relevant to determining your individual tax obligations, financial performance and investment returns on a rental property that are NOT factored into this calculator. By using this calculator, you understand that the numbers herein are NOT specific projections of what your returns will actually be, and you agree that it is YOUR DUTY to consult with your own tax and financial professionals about the evaluation, risk assessment, realistic financial expectations, and actual tax obligations associated with any real estate investment. You also understand that ALL real estate investing involves risk, which buyer assumes 100%, and that no specific returns can ever be guaranteed by anyone.

    Top

    INSTRUCTIONS

    Click into any Investor INPUTS (THE ORANGE FIELDS) to modify.
    Click any field LABEL to view a definition.
    Click CALCULATE to update financial calculations on ALL TABS.
    Purchase
    Monthly Cashflow
    Tax Benefits
    Future Assumptions

    INSTRUCTIONS

    Click into any Investor INPUTS (THE ORANGE FIELDS) to modify.
    Click any field LABEL to view a definition.
    Click CALCULATE to update financial calculations on ALL TABS.
    Cash to Purchase
    Purchase Price
    $549,900
    Fair Market Value
    $549,900
    Down Payment Amount
    $109,980
    Depreciable Closing Costs
    $3,000
    Lender Fees / Points
    $3,000
    Total Cash Invested
    $115,980
    Total Equity at Purchase
    $109,980
    Morgage Calculation
    Loan Amount
    $439,920
    Monthly Mortgage Payment
    $2,362
    First Year Mortgage Principal Paid Down
    $6,490
    First Year Mortgage Interest Paid
    $21,849

    INSTRUCTIONS

    Click into any Investor INPUTS (THE ORANGE FIELDS) to modify.
    Click any field LABEL to view a definition.
    Click CALCULATE to update financial calculations on ALL TABS.
    First Year Monthly Cashflow
    Gross Scheduled Rent
    $3,750
    Vacancy Estimate
    $188
    Gross Operating Income
    $3,563
    Property Taxes
    $320
    Insurance
    $100
    Other Expense
    $0
    Owner-Paid Utilities / Landscaping
    $0
    Property Management Fee
    $375
    Maintenance Estimate
    $150
    Total Operating Expenses
    $945
    Net Operating Income (NOI)
    $2,618
    Mortgage Payment
    $2,362
    Cash Flow Before Taxes
    $256
    Gross Rent Multiplier (GRM)
    12.2
    Rent to Value Ratio (RV Ratio)
    0.7%
    Capitalization Rate (Cap Rate)
    5.7%
    Cash on Cash Return
    2.6%

    INSTRUCTIONS

    Click into any Investor INPUTS (THE ORANGE FIELDS) to modify.
    Click any field LABEL to view a definition.
    Click CALCULATE to update financial calculations on ALL TABS.
    Tax Benefits
    Value of (Non-Depreciable) Land
    $54,990
    Value of (Depreciable) Property Structure
    $494,910
    Depreciable "Cost Basis" at Purchase
    $497,910
    Annual Straight Line Depreciation of Cost Basis
    $18,106
    Annual Depreciation of Lender Fees / Costs
    $100
    First Year Total Depreciation
    $18,206
    First Year Taxable Income Before Depreciation
    $9,561
    First Year Taxable Income Offset by Depreciation
    $9,561
    First Year Remaining Taxable Income After Depreciation
    $0
    First Year Federal Income Taxes Owed on Rental Income
    $0
    First Year Tax Savings from Depreciation on Rental Income
    $3,060
    First Year Left Over Depreciation
    $8,644

    INSTRUCTIONS

    Click into any Investor INPUTS (THE ORANGE FIELDS) to modify.
    Click any field LABEL to view a definition.
    Click CALCULATE to update financial calculations on ALL TABS.
    (Swipe left or right to scroll horizontally)
    Annual Income
    Year 1Year 2Year 3Year 4Year 5Year 6Year 7Year 8Year 9Year 10Year 11Year 12Year 13Year 14Year 15Year 16Year 17Year 18Year 19Year 20Year 21Year 22Year 23Year 24Year 25Year 26Year 27Year 28Year 29Year 30
    Gross Scheduled Rent
    $45,000
    $45,900
    $46,818
    $47,754
    $48,709
    $49,684
    $50,677
    $51,691
    $52,725
    $53,779
    $54,855
    $55,952
    $57,071
    $58,212
    $59,377
    $60,564
    $61,775
    $63,011
    $64,271
    $65,557
    $66,868
    $68,205
    $69,569
    $70,960
    $72,380
    $73,827
    $75,304
    $76,810
    $78,346
    $79,913
    Vacancy Loss
    $2,250
    $2,295
    $2,341
    $2,388
    $2,435
    $2,484
    $2,534
    $2,585
    $2,636
    $2,689
    $2,743
    $2,798
    $2,854
    $2,911
    $2,969
    $3,028
    $3,089
    $3,151
    $3,214
    $3,278
    $3,343
    $3,410
    $3,478
    $3,548
    $3,619
    $3,691
    $3,765
    $3,840
    $3,917
    $3,996
    Gross Operating Income
    $42,750
    $43,605
    $44,477
    $45,367
    $46,274
    $47,199
    $48,143
    $49,106
    $50,088
    $51,090
    $52,112
    $53,154
    $54,217
    $55,302
    $56,408
    $57,536
    $58,687
    $59,860
    $61,058
    $62,279
    $63,524
    $64,795
    $66,091
    $67,412
    $68,761
    $70,136
    $71,539
    $72,969
    $74,429
    $75,917
    Annual Operating Expenses
    Year 1Year 2Year 3Year 4Year 5Year 6Year 7Year 8Year 9Year 10Year 11Year 12Year 13Year 14Year 15Year 16Year 17Year 18Year 19Year 20Year 21Year 22Year 23Year 24Year 25Year 26Year 27Year 28Year 29Year 30
    Property Taxes
    $3,840
    $3,840
    $3,840
    $3,840
    $3,840
    $3,840
    $3,840
    $3,840
    $3,840
    $3,840
    $3,840
    $3,840
    $3,840
    $3,840
    $3,840
    $3,840
    $3,840
    $3,840
    $3,840
    $3,840
    $3,840
    $3,840
    $3,840
    $3,840
    $3,840
    $3,840
    $3,840
    $3,840
    $3,840
    $3,840
    Insurance
    $1,200
    $1,200
    $1,200
    $1,200
    $1,200
    $1,200
    $1,200
    $1,200
    $1,200
    $1,200
    $1,200
    $1,200
    $1,200
    $1,200
    $1,200
    $1,200
    $1,200
    $1,200
    $1,200
    $1,200
    $1,200
    $1,200
    $1,200
    $1,200
    $1,200
    $1,200
    $1,200
    $1,200
    $1,200
    $1,200
    Maintenance Assumption
    $1,800
    $1,836
    $1,873
    $1,910
    $1,948
    $1,987
    $2,027
    $2,068
    $2,109
    $2,151
    $2,194
    $2,238
    $2,283
    $2,328
    $2,375
    $2,423
    $2,471
    $2,520
    $2,571
    $2,622
    $2,675
    $2,728
    $2,783
    $2,838
    $2,895
    $2,953
    $3,012
    $3,072
    $3,134
    $3,197
    Property Management
    $4,500
    $4,590
    $4,682
    $4,775
    $4,871
    $4,968
    $5,068
    $5,169
    $5,272
    $5,378
    $5,485
    $5,595
    $5,707
    $5,821
    $5,938
    $6,056
    $6,178
    $6,301
    $6,427
    $6,556
    $6,687
    $6,820
    $6,957
    $7,096
    $7,238
    $7,383
    $7,530
    $7,681
    $7,835
    $7,991
    Owner-Paid Utilities / Landscaping
    $0
    $0
    $0
    $0
    $0
    $0
    $0
    $0
    $0
    $0
    $0
    $0
    $0
    $0
    $0
    $0
    $0
    $0
    $0
    $0
    $0
    $0
    $0
    $0
    $0
    $0
    $0
    $0
    $0
    $0
    Other Expense
    $0
    $0
    $0
    $0
    $0
    $0
    $0
    $0
    $0
    $0
    $0
    $0
    $0
    $0
    $0
    $0
    $0
    $0
    $0
    $0
    $0
    $0
    $0
    $0
    $0
    $0
    $0
    $0
    $0
    $0
    Total Operating Expenses
    $11,340
    $11,466
    $11,595
    $11,726
    $11,859
    $11,996
    $12,135
    $12,277
    $12,421
    $12,569
    $12,720
    $12,873
    $13,030
    $13,190
    $13,353
    $13,519
    $13,689
    $13,862
    $14,038
    $14,218
    $14,401
    $14,589
    $14,780
    $14,974
    $15,173
    $15,376
    $15,583
    $15,793
    $16,008
    $16,228
    Annual Debt Service
    Year 1Year 2Year 3Year 4Year 5Year 6Year 7Year 8Year 9Year 10Year 11Year 12Year 13Year 14Year 15Year 16Year 17Year 18Year 19Year 20Year 21Year 22Year 23Year 24Year 25Year 26Year 27Year 28Year 29Year 30
    Debt Service
    $28,339
    $28,339
    $28,339
    $28,339
    $28,339
    $28,339
    $28,339
    $28,339
    $28,339
    $28,339
    $28,339
    $28,339
    $28,339
    $28,339
    $28,339
    $28,339
    $28,339
    $28,339
    $28,339
    $28,339
    $28,339
    $28,339
    $28,339
    $28,339
    $28,339
    $28,339
    $28,339
    $28,339
    $28,339
    $28,339
    Mortgage Balance at Year End
    $433,430
    $426,607
    $419,436
    $411,897
    $403,973
    $395,643
    $386,888
    $377,684
    $368,010
    $357,840
    $347,150
    $335,914
    $324,102
    $311,686
    $298,635
    $284,916
    $270,495
    $255,337
    $239,403
    $222,653
    $205,047
    $186,540
    $167,087
    $146,637
    $125,142
    $102,547
    $78,796
    $53,830
    $27,586
    -
    Debt Service Coverage Ratio
    1.11%
    1.13%
    1.16%
    1.19%
    1.21%
    1.24%
    1.27%
    1.3%
    1.33%
    1.36%
    1.39%
    1.42%
    1.45%
    1.49%
    1.52%
    1.55%
    1.59%
    1.62%
    1.66%
    1.7%
    1.73%
    1.77%
    1.81%
    1.85%
    1.89%
    1.93%
    1.97%
    2.02%
    2.06%
    2.11%
    Annual Capital Improvements
    Year 1Year 2Year 3Year 4Year 5Year 6Year 7Year 8Year 9Year 10Year 11Year 12Year 13Year 14Year 15Year 16Year 17Year 18Year 19Year 20Year 21Year 22Year 23Year 24Year 25Year 26Year 27Year 28Year 29Year 30
    Capital Improvements
    $0
    $0
    $0
    $0
    $0
    $0
    $0
    $0
    $0
    $0
    $0
    $0
    $0
    $0
    $0
    $0
    $0
    $0
    $0
    $0
    $0
    $0
    $0
    $0
    $0
    $0
    $0
    $0
    $0
    $0
    Annual Cash Flow Analysis
    Year 1Year 2Year 3Year 4Year 5Year 6Year 7Year 8Year 9Year 10Year 11Year 12Year 13Year 14Year 15Year 16Year 17Year 18Year 19Year 20Year 21Year 22Year 23Year 24Year 25Year 26Year 27Year 28Year 29Year 30
    Net Operating Income
    $31,410
    $32,139
    $32,883
    $33,641
    $34,415
    $35,204
    $36,009
    $36,830
    $37,667
    $38,521
    $39,392
    $40,281
    $41,187
    $42,112
    $43,055
    $44,017
    $44,998
    $45,999
    $47,020
    $48,061
    $49,123
    $50,206
    $51,311
    $52,438
    $53,588
    $54,760
    $55,956
    $57,176
    $58,420
    $59,690
    Capitalization Rate
    5.7%
    5.8%
    6%
    6.1%
    6.3%
    6.4%
    6.5%
    6.7%
    6.8%
    7%
    7.2%
    7.3%
    7.5%
    7.7%
    7.8%
    8%
    8.2%
    8.4%
    8.6%
    8.7%
    8.9%
    9.1%
    9.3%
    9.5%
    9.7%
    10%
    10.2%
    10.4%
    10.6%
    10.9%
    Cash Flow Before Taxes
    $3,071
    $3,800
    $4,544
    $5,302
    $6,076
    $6,865
    $7,670
    $8,491
    $9,328
    $10,182
    $11,053
    $11,942
    $12,848
    $13,773
    $14,716
    $15,678
    $16,659
    $17,660
    $18,681
    $19,722
    $20,784
    $21,867
    $22,972
    $24,099
    $25,249
    $26,421
    $27,617
    $28,837
    $30,081
    $31,351
    Cash on Cash Return
    2.6%
    3.3%
    3.9%
    4.6%
    5.2%
    5.9%
    6.6%
    7.3%
    8%
    8.8%
    9.5%
    10.3%
    11.1%
    11.9%
    12.7%
    13.5%
    14.4%
    15.2%
    16.1%
    17%
    17.9%
    18.9%
    19.8%
    20.8%
    21.8%
    22.8%
    23.8%
    24.9%
    25.9%
    27%
    Annual Equity Accumulation
    Year 1Year 2Year 3Year 4Year 5Year 6Year 7Year 8Year 9Year 10Year 11Year 12Year 13Year 14Year 15Year 16Year 17Year 18Year 19Year 20Year 21Year 22Year 23Year 24Year 25Year 26Year 27Year 28Year 29Year 30
    Property Appreciation
    $21,996
    $22,876
    $23,791
    $24,743
    $25,732
    $26,761
    $27,832
    $28,945
    $30,103
    $31,307
    $32,559
    $33,862
    $35,216
    $36,625
    $38,090
    $39,614
    $41,198
    $42,846
    $44,560
    $46,342
    $48,196
    $50,124
    $52,129
    $54,214
    $56,382
    $58,638
    $60,983
    $63,423
    $65,959
    $68,598
    Mortgage Principal Pay Down
    $6,490
    $6,822
    $7,172
    $7,538
    $7,924
    $8,330
    $8,756
    $9,204
    $9,675
    $10,170
    $10,690
    $11,237
    $11,812
    $12,416
    $13,051
    $13,719
    $14,421
    $15,159
    $15,934
    $16,749
    $17,606
    $18,507
    $19,454
    $20,449
    $21,495
    $22,595
    $23,751
    $24,966
    $26,244
    $27,586
    Total Equity Growth
    $28,486
    $29,698
    $30,962
    $32,281
    $33,656
    $35,091
    $36,588
    $38,149
    $39,778
    $41,477
    $43,249
    $45,099
    $47,028
    $49,041
    $51,141
    $53,332
    $55,619
    $58,005
    $60,494
    $63,092
    $65,802
    $68,631
    $71,583
    $74,663
    $77,878
    $81,233
    $84,734
    $88,389
    $92,203
    $96,184
    Annual Tax Savings From Depreciation
    Year 1Year 2Year 3Year 4Year 5Year 6Year 7Year 8Year 9Year 10Year 11Year 12Year 13Year 14Year 15Year 16Year 17Year 18Year 19Year 20Year 21Year 22Year 23Year 24Year 25Year 26Year 27Year 28Year 29Year 30
    Straight Line Depreciation of Cost Basis
    $18,206
    $18,206
    $18,206
    $18,206
    $18,206
    $18,206
    $18,206
    $18,206
    $18,206
    $18,206
    $18,206
    $18,206
    $18,206
    $18,206
    $18,206
    $18,206
    $18,206
    $18,206
    $18,206
    $18,206
    $18,206
    $18,206
    $18,206
    $18,206
    $18,206
    $18,206
    $18,206
    $9,103
    $0
    $0
    Straight Line Depreciaiton of Lender Fees / Points
    $100
    $100
    $100
    $100
    $100
    $100
    $100
    $100
    $100
    $100
    $100
    $100
    $100
    $100
    $100
    $100
    $100
    $100
    $100
    $100
    $100
    $100
    $100
    $100
    $100
    $100
    $100
    $100
    $100
    $100
    Total Straight Line Depreciation
    $18,306
    $18,306
    $18,306
    $18,306
    $18,306
    $18,306
    $18,306
    $18,306
    $18,306
    $18,306
    $18,306
    $18,306
    $18,306
    $18,306
    $18,306
    $18,306
    $18,306
    $18,306
    $18,306
    $18,306
    $18,306
    $18,306
    $18,306
    $18,306
    $18,306
    $18,306
    $18,306
    $9,203
    $100
    $100
    Taxable Income Before Depreciation
    $9,561
    $10,622
    $11,715
    $12,840
    $14,000
    $15,194
    $16,425
    $17,694
    $19,002
    $20,352
    $21,743
    $23,179
    $24,660
    $26,189
    $27,767
    $29,397
    $31,080
    $32,818
    $34,615
    $36,471
    $38,390
    $40,374
    $42,426
    $44,548
    $46,744
    $49,016
    $51,368
    $53,803
    $56,325
    $58,937
    Carry Forward Loss From Depreciation
    $8,744
    $16,428
    $23,019
    $28,484
    $32,790
    $35,901
    $37,782
    $38,394
    $37,697
    $35,651
    $32,214
    $27,341
    $20,987
    $13,104
    $3,643
    $0
    $0
    $0
    $0
    $0
    $0
    $0
    $0
    $0
    $0
    $0
    $0
    $0
    $0
    $0
    Taxable Income Offset by Depreciation
    $9,561
    $10,622
    $11,715
    $12,840
    $14,000
    $15,194
    $16,425
    $17,694
    $19,002
    $20,352
    $21,743
    $23,179
    $24,660
    $26,189
    $27,767
    $21,948
    $18,306
    $18,306
    $18,306
    $18,306
    $18,306
    $18,306
    $18,306
    $18,306
    $18,306
    $18,306
    $18,306
    $9,203
    $100
    $100
    Remaining Taxable Income After Depreciation
    $0
    $0
    $0
    $0
    $0
    $0
    $0
    $0
    $0
    $0
    $0
    $0
    $0
    $0
    $0
    $7,448
    $12,774
    $14,512
    $16,309
    $18,165
    $20,084
    $22,068
    $24,120
    $26,242
    $28,438
    $30,710
    $33,062
    $44,600
    $56,225
    $58,837
    Federal Income Tax Owed on Rental Income
    $0
    $0
    $0
    $0
    $0
    $0
    $0
    $0
    $0
    $0
    $0
    $0
    $0
    $0
    $0
    $2,383
    $4,088
    $4,644
    $5,219
    $5,813
    $6,427
    $7,062
    $7,718
    $8,398
    $9,100
    $9,827
    $10,580
    $14,272
    $17,992
    $18,828
    Tax Savings from Depreciation
    $3,060
    $3,399
    $3,749
    $4,109
    $4,480
    $4,862
    $5,256
    $5,662
    $6,081
    $6,513
    $6,958
    $7,417
    $7,891
    $8,380
    $8,885
    $7,023
    $5,858
    $5,858
    $5,858
    $5,858
    $5,858
    $5,858
    $5,858
    $5,858
    $5,858
    $5,858
    $5,858
    $2,945
    $32
    $32
    Cash Flow After Taxes
    $3,071
    $3,800
    $4,544
    $5,302
    $6,076
    $6,865
    $7,670
    $8,491
    $9,328
    $10,182
    $11,053
    $11,942
    $12,848
    $13,773
    $14,716
    $13,294
    $12,571
    $13,016
    $13,462
    $13,909
    $14,357
    $14,805
    $15,254
    $15,701
    $16,148
    $16,594
    $17,037
    $14,565
    $12,089
    $12,523
    Performance Over Time
    Year 1Year 2Year 3Year 4Year 5Year 6Year 7Year 8Year 9Year 10Year 11Year 12Year 13Year 14Year 15Year 16Year 17Year 18Year 19Year 20Year 21Year 22Year 23Year 24Year 25Year 26Year 27Year 28Year 29Year 30
    Fair Market Property Value at Year End
    $571,896
    $594,772
    $618,563
    $643,305
    $669,037
    $695,799
    $723,631
    $752,576
    $782,679
    $813,986
    $846,546
    $880,408
    $915,624
    $952,249
    $990,339
    $1,029,952
    $1,071,150
    $1,113,997
    $1,158,556
    $1,204,899
    $1,253,095
    $1,303,218
    $1,355,347
    $1,409,561
    $1,465,943
    $1,524,581
    $1,585,564
    $1,648,987
    $1,714,946
    $1,783,544
    Cumulative Appreciation
    $21,996
    $44,872
    $68,663
    $93,405
    $119,137
    $145,899
    $173,731
    $202,676
    $232,779
    $264,086
    $296,646
    $330,508
    $365,724
    $402,349
    $440,439
    $480,052
    $521,250
    $564,097
    $608,656
    $654,999
    $703,195
    $753,318
    $805,447
    $859,661
    $916,043
    $974,681
    $1,035,664
    $1,099,087
    $1,165,046
    $1,233,644
    Cumulative Mortgage Principal Paydown
    $6,490
    $13,313
    $20,484
    $28,023
    $35,947
    $44,277
    $53,032
    $62,236
    $71,910
    $82,080
    $92,770
    $104,006
    $115,818
    $128,234
    $141,285
    $155,004
    $169,425
    $184,583
    $200,517
    $217,267
    $234,873
    $253,380
    $272,833
    $293,283
    $314,778
    $337,373
    $361,124
    $386,090
    $412,334
    $439,920
    Total Cumulative Equity
    $138,466
    $168,165
    $199,127
    $231,408
    $265,064
    $300,156
    $336,743
    $374,892
    $414,670
    $456,146
    $499,396
    $544,494
    $591,522
    $640,563
    $691,704
    $745,036
    $800,655
    $858,660
    $919,154
    $982,245
    $1,048,047
    $1,116,678
    $1,188,261
    $1,262,924
    $1,340,801
    $1,422,034
    $1,506,768
    $1,595,157
    $1,687,360
    $1,783,544
    Cumulative Cash Flow Before Taxes
    $3,071
    $6,871
    $11,414
    $16,716
    $22,792
    $29,657
    $37,326
    $45,817
    $55,145
    $65,327
    $76,380
    $88,322
    $101,171
    $114,944
    $129,660
    $145,337
    $161,997
    $179,656
    $198,337
    $218,059
    $238,842
    $260,709
    $283,681
    $307,780
    $333,029
    $359,450
    $387,067
    $415,904
    $445,985
    $477,336
    Cumulative Tax Savings From Depreciation
    $3,060
    $6,459
    $10,208
    $14,317
    $18,797
    $23,659
    $28,915
    $34,577
    $40,658
    $47,170
    $54,128
    $61,545
    $69,436
    $77,817
    $86,702
    $93,726
    $99,584
    $105,442
    $111,299
    $117,157
    $123,015
    $128,873
    $134,731
    $140,589
    $146,447
    $152,304
    $158,162
    $161,107
    $161,139
    $161,171
    Cumulative Cash Flow After Taxes
    $3,071
    $6,871
    $11,414
    $16,716
    $22,792
    $29,657
    $37,326
    $45,817
    $55,145
    $65,327
    $76,380
    $88,322
    $101,171
    $114,944
    $129,660
    $142,954
    $155,525
    $168,541
    $182,003
    $195,912
    $210,269
    $225,074
    $240,327
    $256,029
    $272,177
    $288,771
    $305,808
    $320,373
    $332,462
    $344,985
    Total Net Profit if Sold
    -
    $11,474
    $45,077
    $80,680
    $118,354
    $158,168
    $200,199
    $244,523
    $291,220
    $340,374
    $392,072
    $446,404
    $503,463
    $563,347
    $626,156
    $689,614
    $754,508
    $822,101
    $892,492
    $965,785
    $1,042,088
    $1,121,514
    $1,204,180
    $1,290,207
    $1,379,723
    $1,472,859
    $1,569,751
    $1,667,631
    $1,766,647
    $1,869,866
    Total Return on Investment if Sold
    -
    9.89%
    38.87%
    69.56%
    102.05%
    136.38%
    172.62%
    210.83%
    251.1%
    293.48%
    338.05%
    384.9%
    434.09%
    485.73%
    539.88%
    594.6%
    650.55%
    708.83%
    769.52%
    832.72%
    898.51%
    966.99%
    1038.27%
    1112.44%
    1189.62%
    1269.92%
    1353.47%
    1437.86%
    1523.23%
    1612.23%
    Before-Tax Return on Investment if Held
    27.2%
    28.9%
    30.6%
    32.4%
    34.3%
    36.2%
    38.2%
    40.2%
    42.3%
    44.5%
    46.8%
    49.2%
    51.6%
    54.2%
    56.8%
    59.5%
    62.3%
    65.2%
    68.3%
    71.4%
    74.7%
    78%
    81.5%
    85.2%
    88.9%
    92.8%
    96.9%
    101.1%
    105.4%
    110%
    After-Tax Return on Investment if Held
    27.2%
    28.9%
    30.6%
    32.4%
    34.3%
    36.2%
    38.2%
    40.2%
    42.3%
    44.5%
    46.8%
    49.2%
    51.6%
    54.2%
    56.8%
    57.4%
    58.8%
    61.2%
    63.8%
    66.4%
    69.1%
    71.9%
    74.9%
    77.9%
    81.1%
    84.3%
    87.7%
    88.8%
    89.9%
    93.7%
    Internal Rate of Return (IRR)
    -
    4.9%
    11.8%
    14.6%
    15.8%
    16.2%
    16.4%
    16.3%
    16.2%
    16%
    15.8%
    15.5%
    15.3%
    15.1%
    14.8%
    14.6%
    14.4%
    14.2%
    14.1%
    13.9%
    13.7%
    13.6%
    13.4%
    13.3%
    13.1%
    13%
    12.9%
    12.8%
    12.7%
    12.6%