Own Cash-Flowing Rental Properties in the Best U.S. Markets From Anywhere!

Search
Close this search box.

Welcome to Baltimore!

ABOUT Baltimore

Baltimore is one of the Top 20 largest MSAs in the U.S. and saw a net increase of 60,000 new jobs in the last year alone. In 2022, Baltimore announced an extensive redevelopment initiative to “completely re-imagine” and revitalize Harbor Place–the centerpiece of the city’s downtown waterfront! (Baltimore Sun). Baltimore home prices increased 10% last year (FHFA.gov) and rents have also been increasing year over year (Realtor.com). Baltimore is one of the most advantageous cash flow markets in the U.S. right now and Attom Data recently ranked it as one of the Top 5 U.S. cities for the “highest potential annual gross rental yields”.

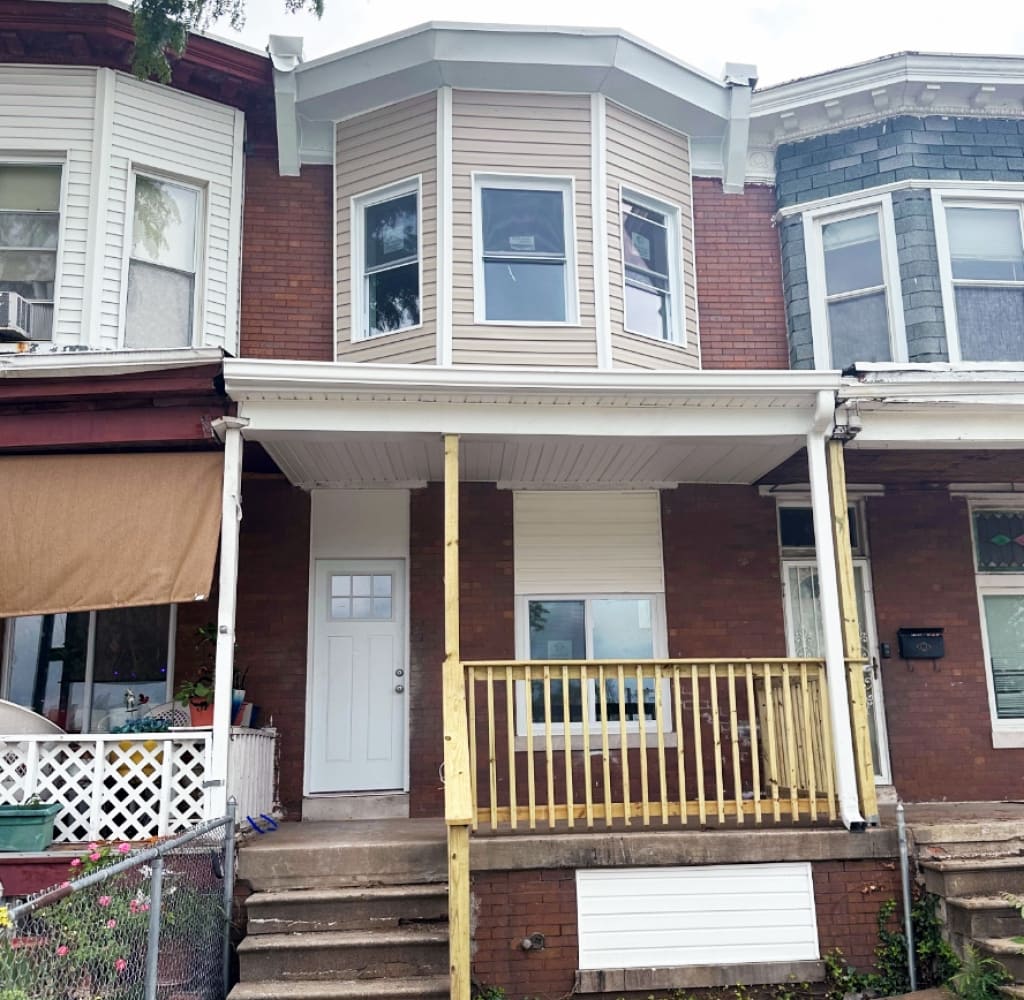
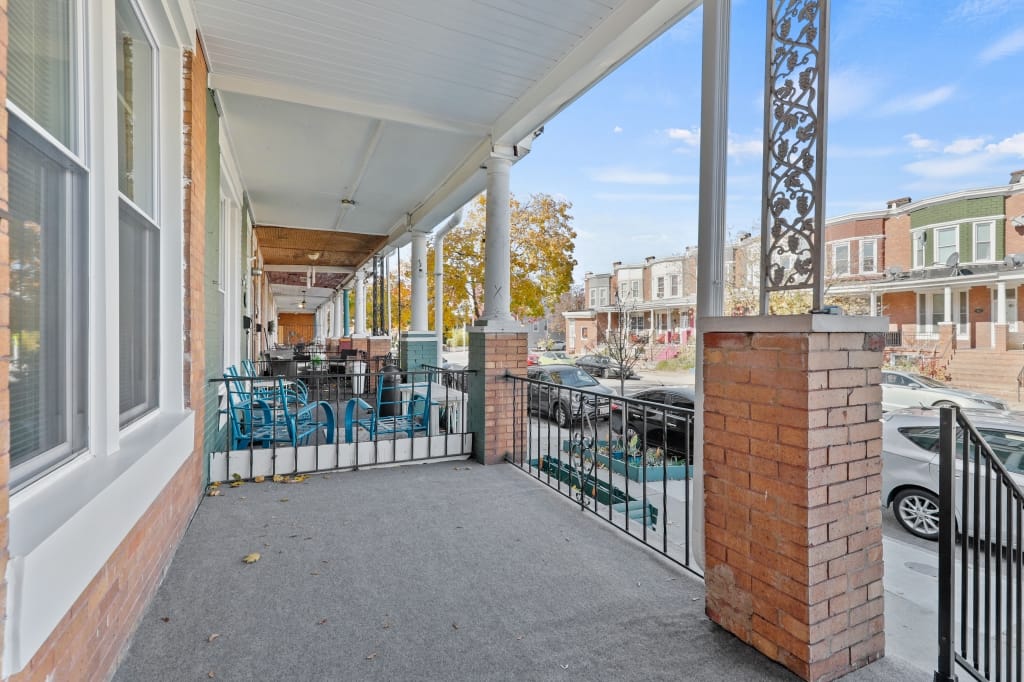
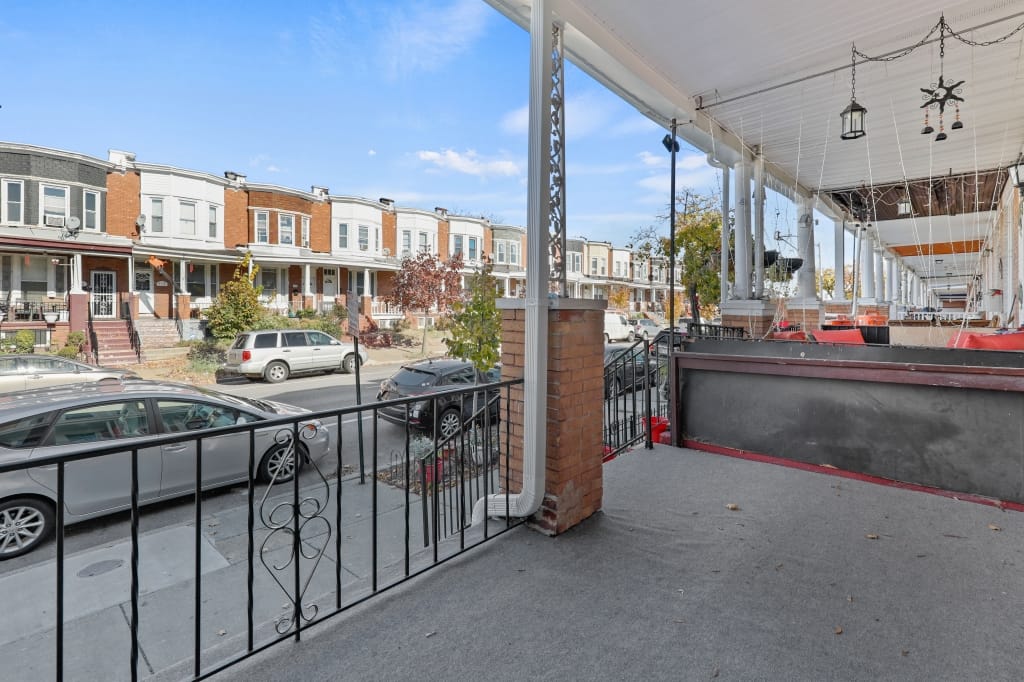
Fenwick Avenue Baltimore, MD

RESERVE THIS PROPERTY

OFFERED BY THE SELLER

Seller warranties:

  • 1 year workmanship warranty

Manufacturer warranties:

  • 1 Year on new appliances
  • 8 Years on new HVAC
  • 20 Years on new Roof

Snapshot Financials

Price:
$ 195000
Rent:
$ 1675 / mo
Taxes:

Estimated Property Taxes

$ 100
Insurance:

Estimated Insurance

$ 800
HOA Fee:

Home Owners Association Fee

$ 0
PM Fee:

Property Management Fee

$ 101
Other:
$ 0
Other:
$ 0
Vacancy:

Based on 7%

$ 117.25
Repairs:

Based on 5%

$ 83.75
Total:

Total Monthly Expenses

$ 468.667
NOI:

Monthly Net Operating Income ('NOI') = Monthly Gross Scheduled Rent - Monthly Operating Expenses - 5% Maintenance Estimate - 7% Vacancy Estimates. NOI does not take into account any financing that you may be using. The NOI is always an 'estimate' and can never be guaranteed because it includes the non-fixed variables of 'maintenance' and 'vacancy' which vary over time.

$ 1206 / mo
Cap Rate:

Capitalization Rate ('Cap Rate') = Annual Net Operating Income / Purchase Price. Cap Rate does not take into account any financing you may be using nor any closing costs you may be paying.

7.42 %
GRM:

Gross Rent Multiplier ('GRM') = Purchase Price / Annual Gross Scheduled Rent. GRM is only a price to rent ratio and does not take into account any operating expenses, financing, closing cost payments or maintenance and vacancy assumptions. And remember, GRM is like a golf score, the lower the better.
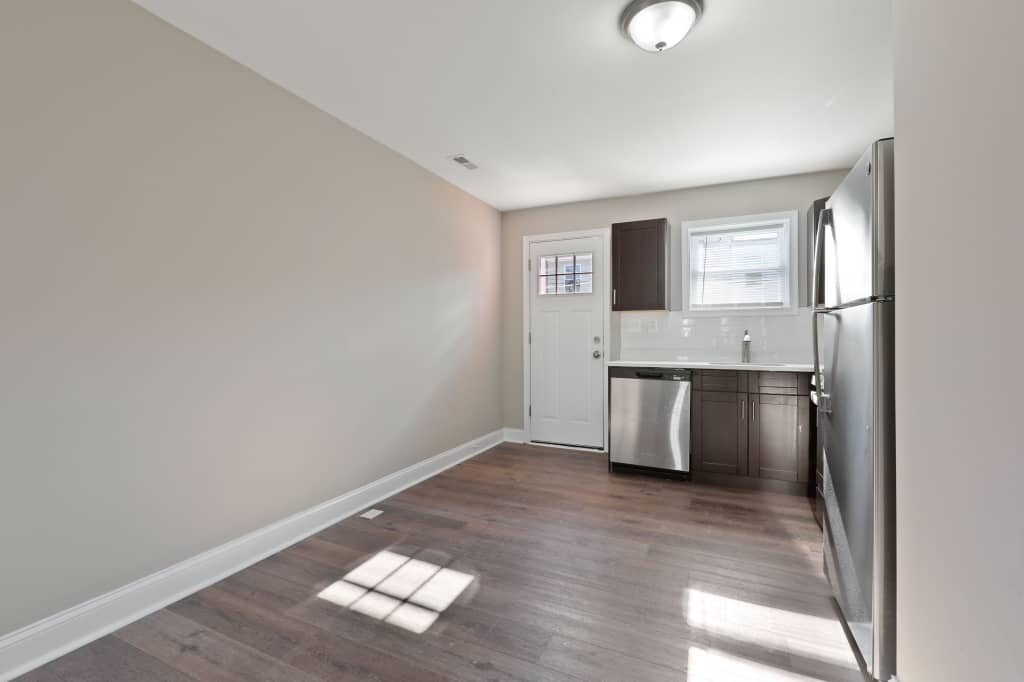
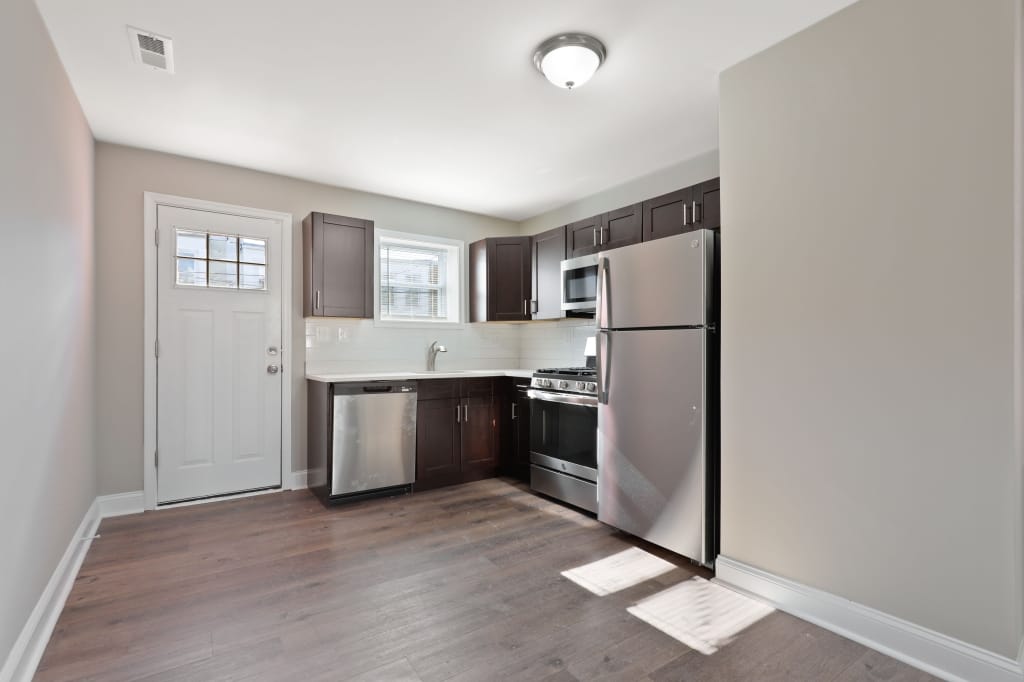
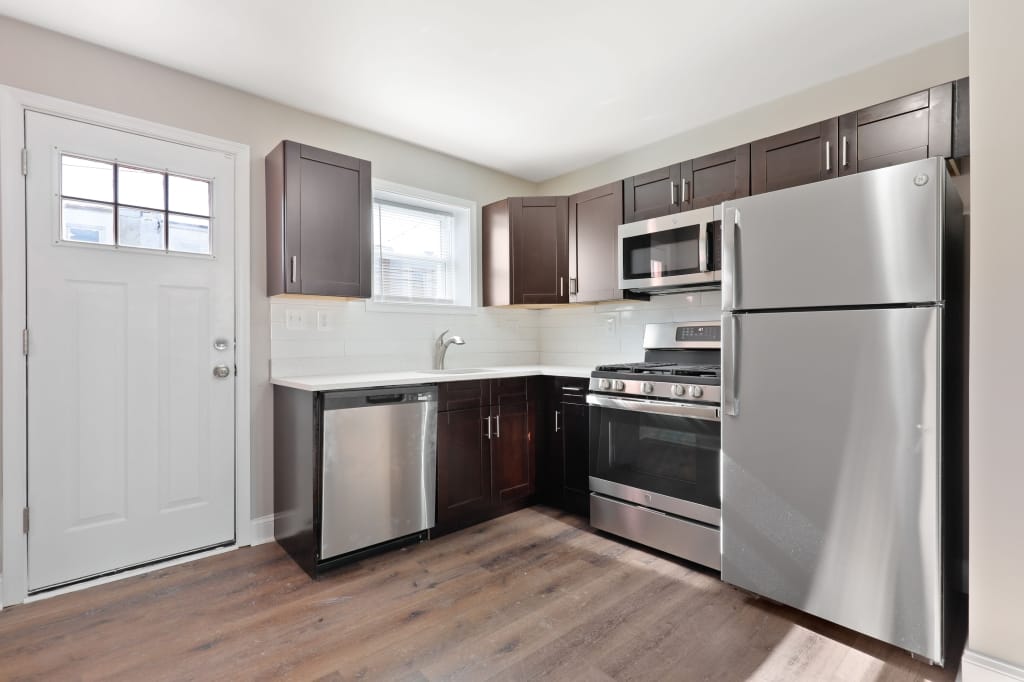
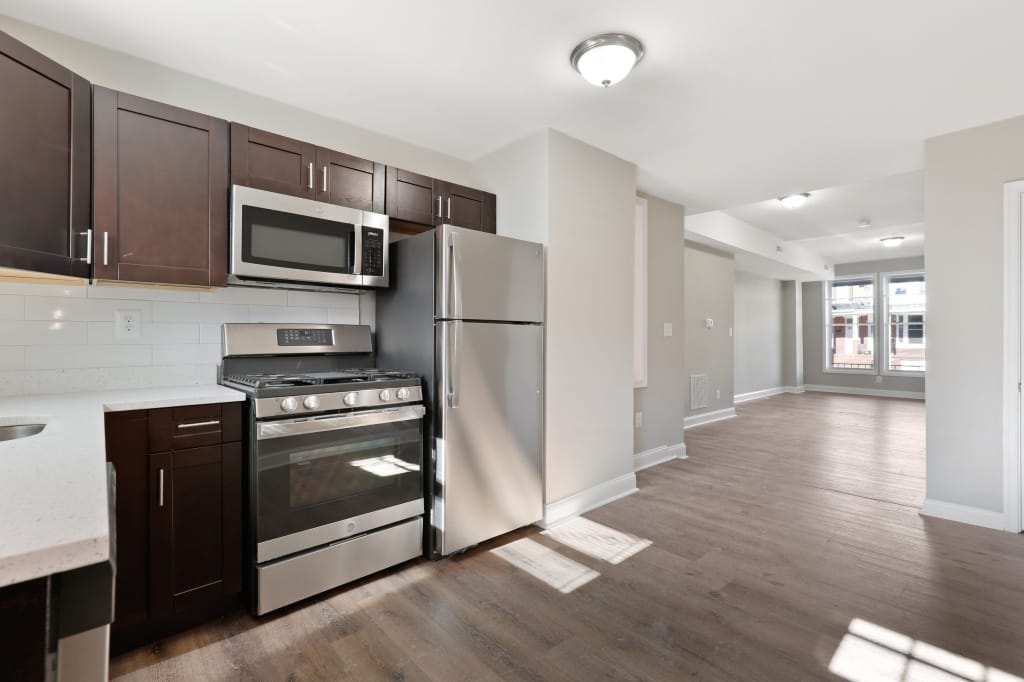
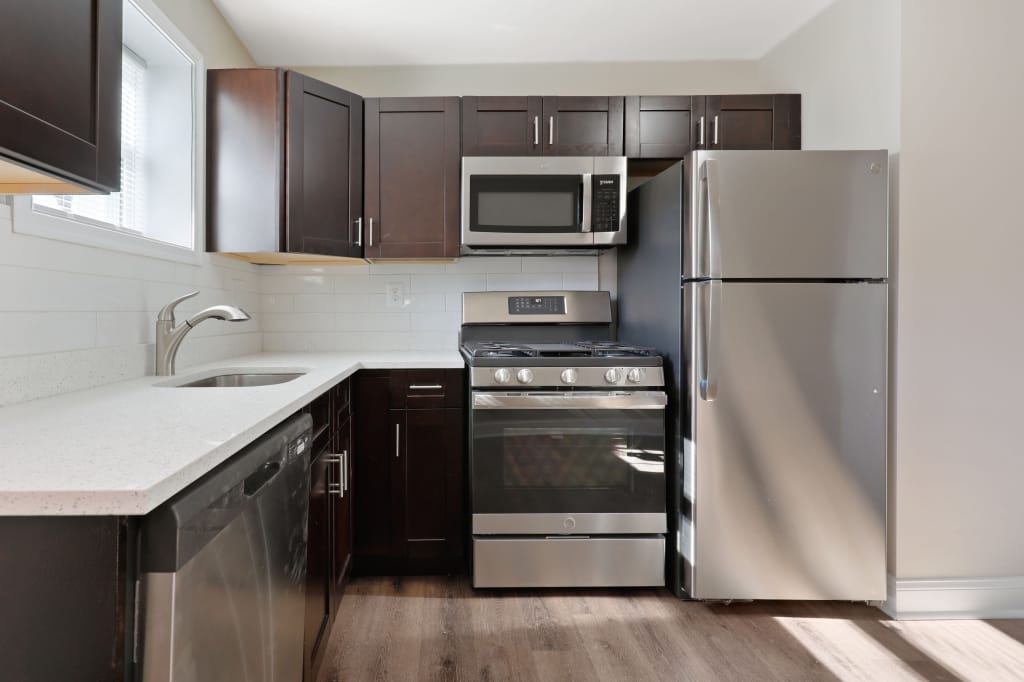
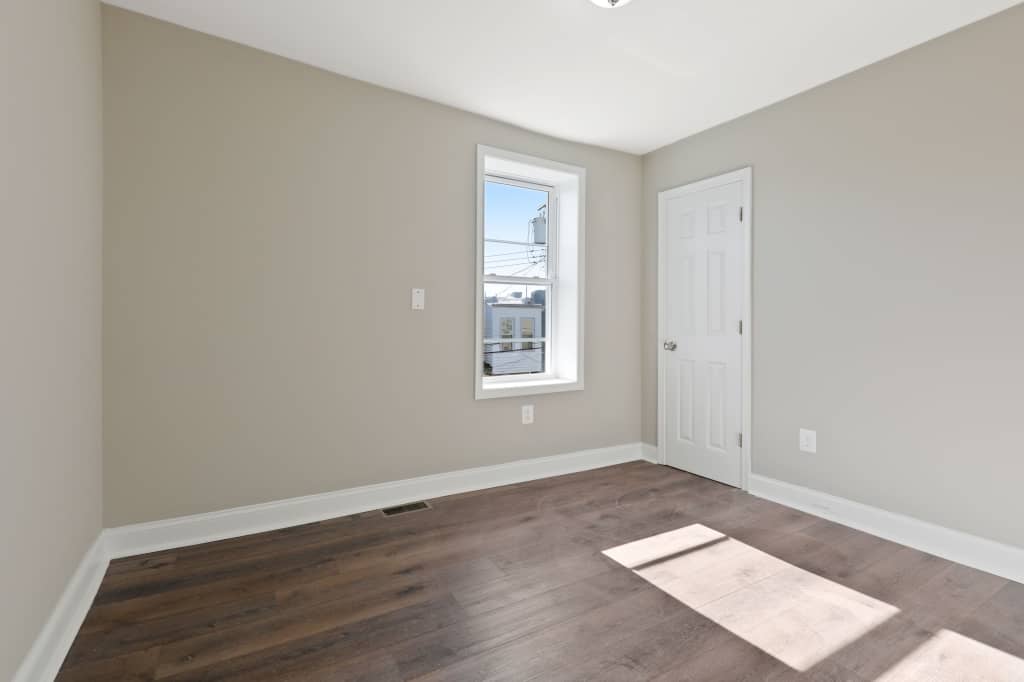
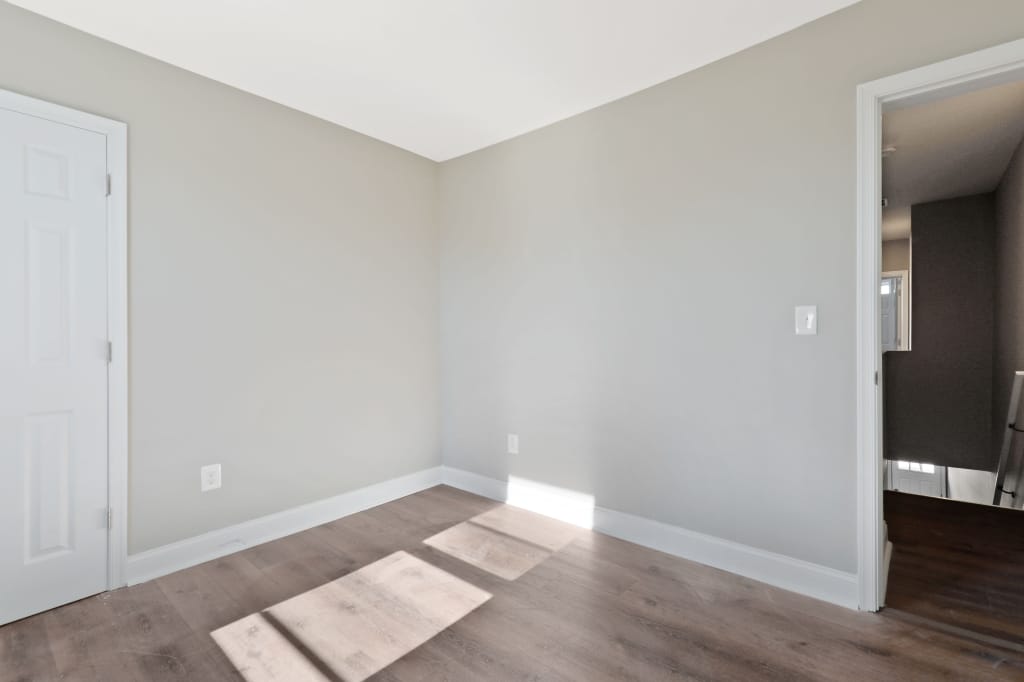
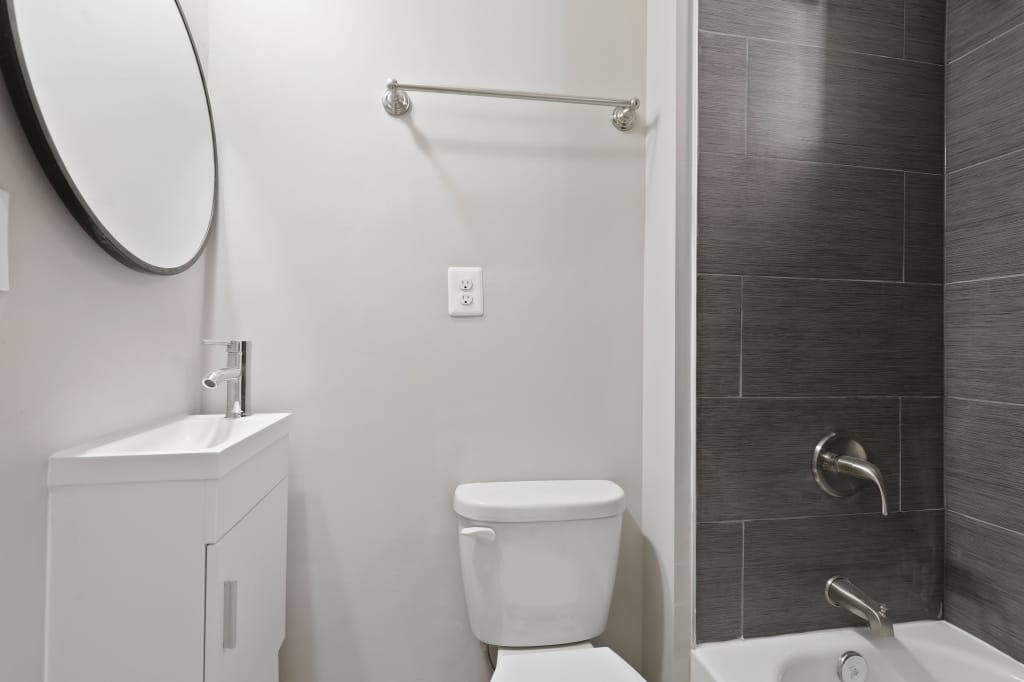
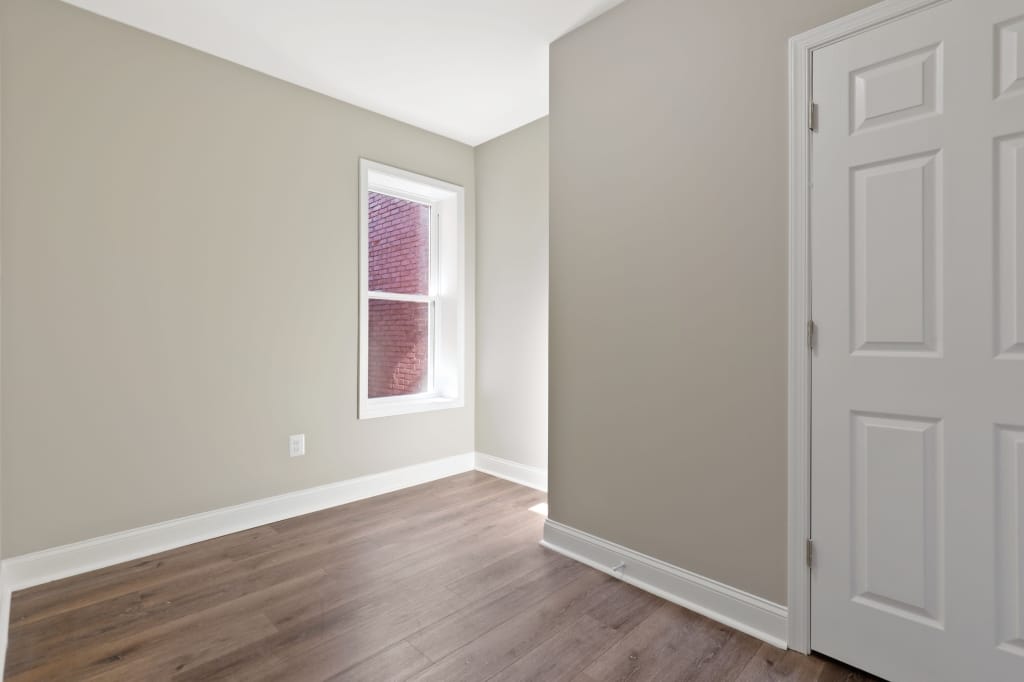
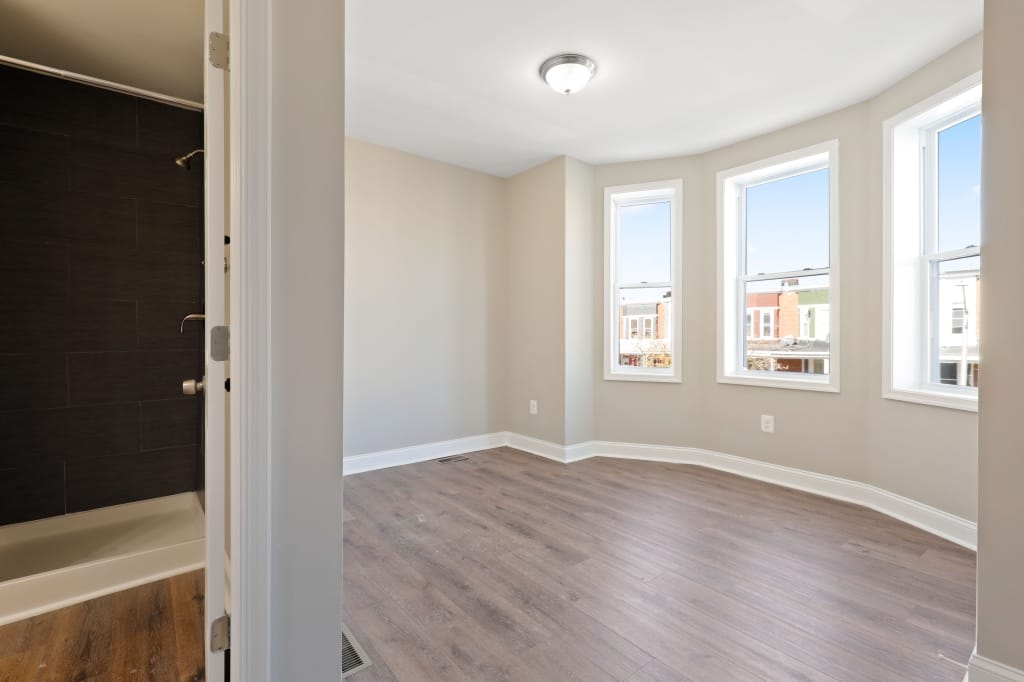
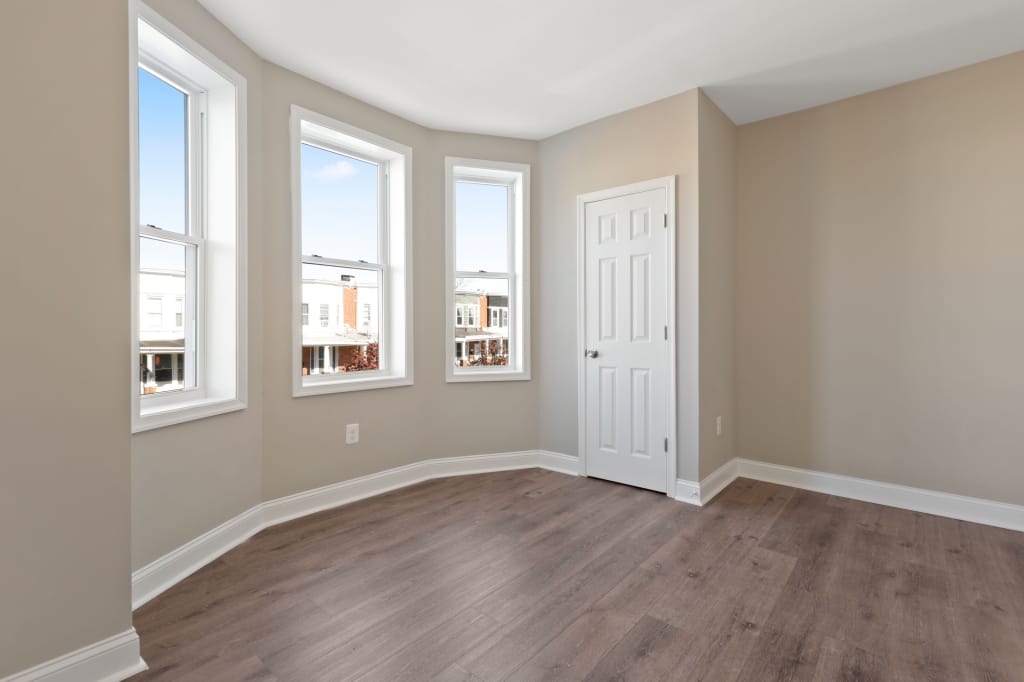
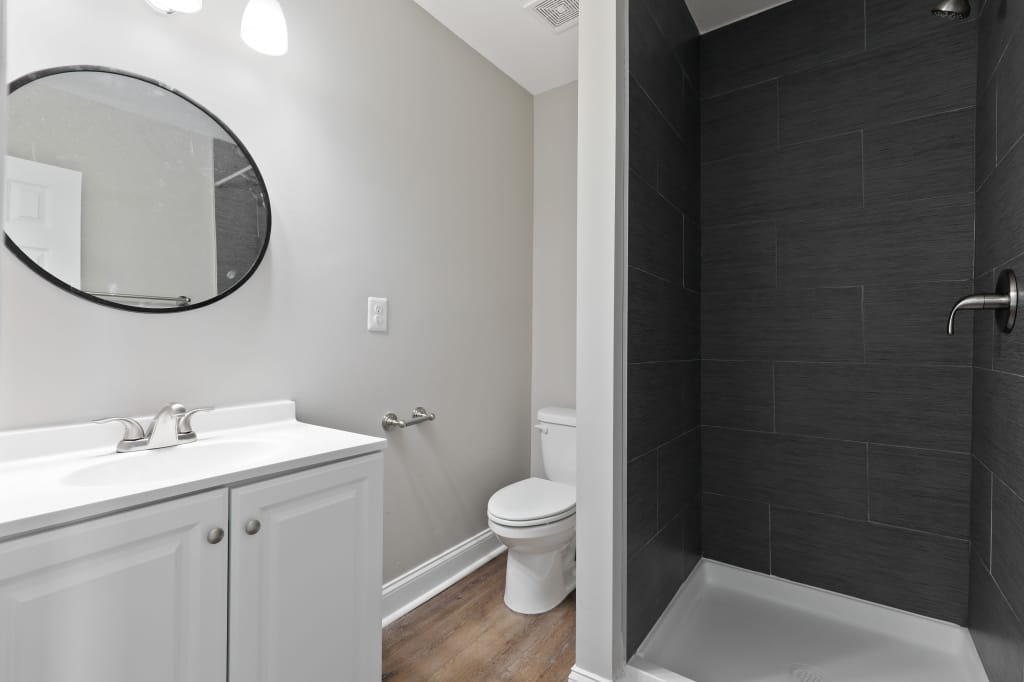
9.7

Property Features

Type:
Townhouse
Condition:
Fully Renovated as Condition of Closing
Rental Status:
Tenant in Place as Condition of Closing
Year Built:
1920
Bedrooms:
2
Bathrooms:
1.5
Floor Area:
1120 Sq Ft
Lot Size:
1,281 Sq Ft
Stories:
2 Stories
Basement:
Unfinished
Parking:
Off-Street Parking
RESERVE THIS PROPERTY

Seller's Additional Notes

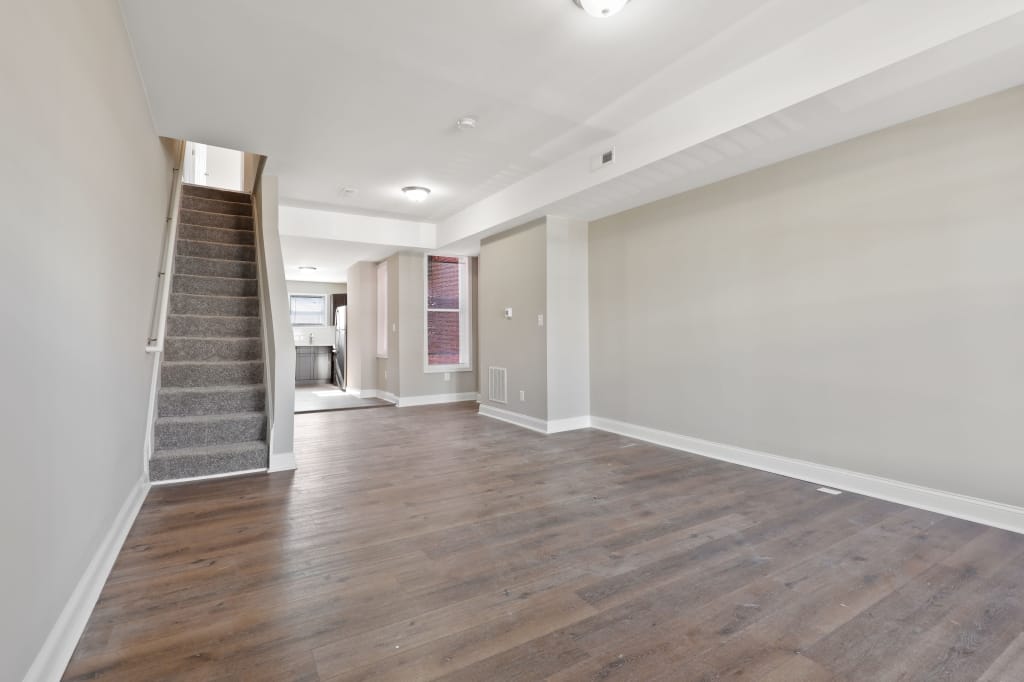
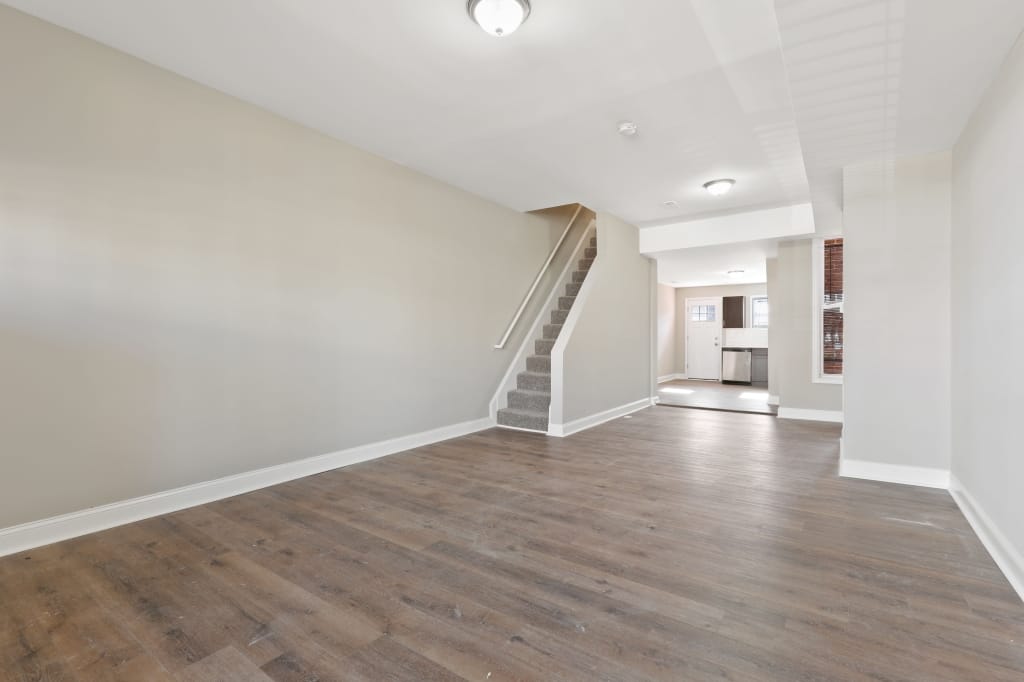
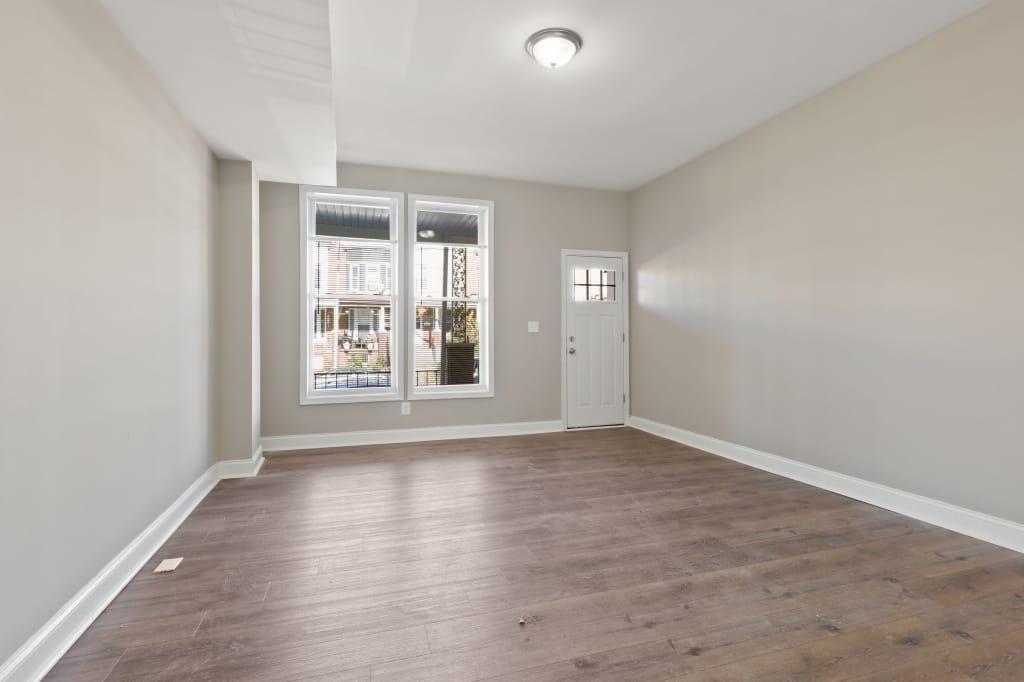
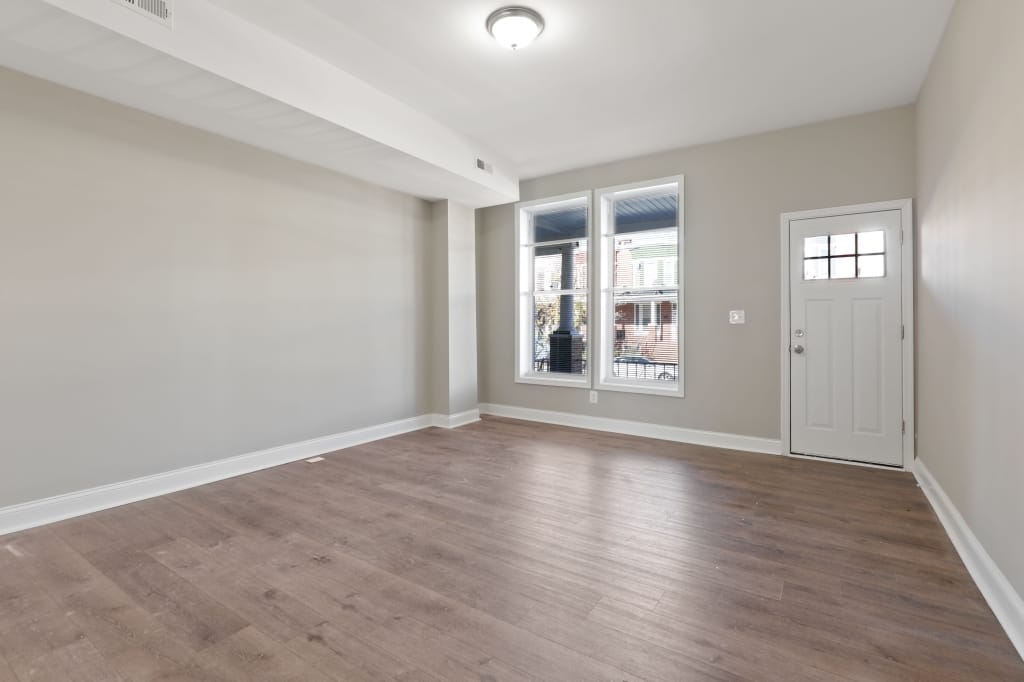
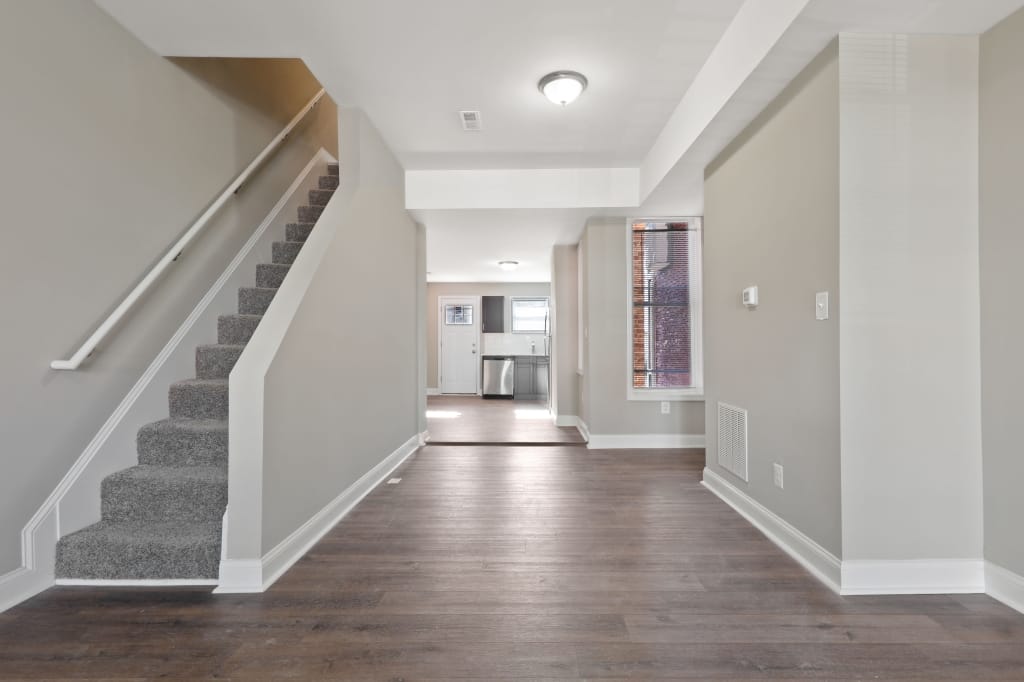
*The interior pictures are samples of previous properties we have completed with a similar layout. The final renovated pictures will be sent upon completion*

Located in a highly desirable, central area – this property is a few blocks away from several parks, The Maryland Zoo and very short ride to Mondawmin Mall. The central location is ideal for commuting downtown, but also easy to travel out of town. Coppin State University is less than one mile away, drawing a diverse tenant base to the neighborhood. This property sits on a very clean block with no vacant properties.

Baltimore Highlights

Baltimore Properties:

  • Fully Renovated Single Family Homes
  • Tenants and Local Property
  • Management in Place at Closing
  • 200K Average Purchase Price
  • 7% Average Cap Rate

Baltimore Market:

  • Full Revitalization of Baltimore Harbor Place Began in 2022 (Baltimore Sun)
  • Ranked Top 5 U.S. Cities for the “Highest Potential Annual Gross Rental Yields” (Attom Data)
  • Ranked “Top 5 Best U.S. Cities to Find Work” (Careerist.com).
  • Net Increase of over 60,000 jobs last year (BLS.gov)
  • 10% Home Price Appreciation Last Year (FHFA.gov)

Similar
Properties

Maverick Property Vault

$1268 Net Operating Income
$1244 Net Operating Income
$1301 Net Operating Income

More Maverick Markets

Subscribe

    GET Access TO Private buying opportunities for TURNKEY Rental properies & EDUCATIONAL RESOURCES. READ OUR PRIVACY NOTICE & TERMS OF USE.

    Maverick's Cash-Flow Calculator

    DISCLAIMER
    OPEN

    This calculator is for recreational use only and is NOT financial or accounting software. There are a litany of variables that may be relevant to determining your individual tax obligations, financial performance and investment returns on a rental property that are NOT factored into this calculator. By using this calculator, you understand that the numbers herein are NOT specific projections of what your returns will actually be, and you agree that it is YOUR DUTY to consult with your own tax and financial professionals about the evaluation, risk assessment, realistic financial expectations, and actual tax obligations associated with any real estate investment. You also understand that ALL real estate investing involves risk, which buyer assumes 100%, and that no specific returns can ever be guaranteed by anyone.

    Top

    INSTRUCTIONS

    Click into any Investor INPUTS (THE ORANGE FIELDS) to modify.
    Click any field LABEL to view a definition.
    Click CALCULATE to update financial calculations on ALL TABS.
    Purchase
    Monthly Cashflow
    Tax Benefits
    Future Assumptions

    INSTRUCTIONS

    Click into any Investor INPUTS (THE ORANGE FIELDS) to modify.
    Click any field LABEL to view a definition.
    Click CALCULATE to update financial calculations on ALL TABS.
    Cash to Purchase
    Purchase Price
    $195,000
    Fair Market Value
    $195,000
    Down Payment Amount
    $39,000
    Depreciable Closing Costs
    $3,000
    Lender Fees / Points
    $3,000
    Total Cash Invested
    $45,000
    Total Equity at Purchase
    $39,000
    Morgage Calculation
    Loan Amount
    $156,000
    Monthly Mortgage Payment
    $837
    First Year Mortgage Principal Paid Down
    $2,302
    First Year Mortgage Interest Paid
    $7,748

    INSTRUCTIONS

    Click into any Investor INPUTS (THE ORANGE FIELDS) to modify.
    Click any field LABEL to view a definition.
    Click CALCULATE to update financial calculations on ALL TABS.
    First Year Monthly Cashflow
    Gross Scheduled Rent
    $1,675
    Vacancy Estimate
    $117
    Gross Operating Income
    $1,558
    Property Taxes
    $150
    Insurance
    $50
    Other Expense
    $0
    Owner-Paid Utilities / Landscaping
    $0
    Property Management Fee
    $168
    Maintenance Estimate
    $84
    Total Operating Expenses
    $451
    Net Operating Income (NOI)
    $1,107
    Mortgage Payment
    $837
    Cash Flow Before Taxes
    $269
    Gross Rent Multiplier (GRM)
    9.7
    Rent to Value Ratio (RV Ratio)
    0.9%
    Capitalization Rate (Cap Rate)
    6.8%
    Cash on Cash Return
    7.2%

    INSTRUCTIONS

    Click into any Investor INPUTS (THE ORANGE FIELDS) to modify.
    Click any field LABEL to view a definition.
    Click CALCULATE to update financial calculations on ALL TABS.
    Tax Benefits
    Value of (Non-Depreciable) Land
    $19,500
    Value of (Depreciable) Property Structure
    $175,500
    Depreciable "Cost Basis" at Purchase
    $178,500
    Annual Straight Line Depreciation of Cost Basis
    $6,491
    Annual Depreciation of Lender Fees / Costs
    $100
    First Year Total Depreciation
    $6,591
    First Year Taxable Income Before Depreciation
    $5,530
    First Year Taxable Income Offset by Depreciation
    $5,530
    First Year Remaining Taxable Income After Depreciation
    $0
    First Year Federal Income Taxes Owed on Rental Income
    $0
    First Year Tax Savings from Depreciation on Rental Income
    $1,770
    First Year Left Over Depreciation
    $1,061

    INSTRUCTIONS

    Click into any Investor INPUTS (THE ORANGE FIELDS) to modify.
    Click any field LABEL to view a definition.
    Click CALCULATE to update financial calculations on ALL TABS.
    (Swipe left or right to scroll horizontally)
    Annual Income
    Year 1Year 2Year 3Year 4Year 5Year 6Year 7Year 8Year 9Year 10Year 11Year 12Year 13Year 14Year 15Year 16Year 17Year 18Year 19Year 20Year 21Year 22Year 23Year 24Year 25Year 26Year 27Year 28Year 29Year 30
    Gross Scheduled Rent
    $20,100
    $20,502
    $20,912
    $21,330
    $21,757
    $22,192
    $22,636
    $23,089
    $23,550
    $24,021
    $24,502
    $24,992
    $25,492
    $26,001
    $26,522
    $27,052
    $27,593
    $28,145
    $28,708
    $29,282
    $29,868
    $30,465
    $31,074
    $31,696
    $32,330
    $32,976
    $33,636
    $34,308
    $34,995
    $35,694
    Vacancy Loss
    $1,407
    $1,435
    $1,464
    $1,493
    $1,523
    $1,553
    $1,585
    $1,616
    $1,649
    $1,681
    $1,715
    $1,749
    $1,784
    $1,820
    $1,857
    $1,894
    $1,932
    $1,970
    $2,010
    $2,050
    $2,091
    $2,133
    $2,175
    $2,219
    $2,263
    $2,308
    $2,354
    $2,402
    $2,450
    $2,499
    Gross Operating Income
    $18,693
    $19,067
    $19,448
    $19,837
    $20,234
    $20,639
    $21,051
    $21,472
    $21,902
    $22,340
    $22,787
    $23,242
    $23,707
    $24,181
    $24,665
    $25,158
    $25,661
    $26,175
    $26,698
    $27,232
    $27,777
    $28,332
    $28,899
    $29,477
    $30,067
    $30,668
    $31,281
    $31,907
    $32,545
    $33,196
    Annual Operating Expenses
    Year 1Year 2Year 3Year 4Year 5Year 6Year 7Year 8Year 9Year 10Year 11Year 12Year 13Year 14Year 15Year 16Year 17Year 18Year 19Year 20Year 21Year 22Year 23Year 24Year 25Year 26Year 27Year 28Year 29Year 30
    Property Taxes
    $1,800
    $1,800
    $1,800
    $1,800
    $1,800
    $1,800
    $1,800
    $1,800
    $1,800
    $1,800
    $1,800
    $1,800
    $1,800
    $1,800
    $1,800
    $1,800
    $1,800
    $1,800
    $1,800
    $1,800
    $1,800
    $1,800
    $1,800
    $1,800
    $1,800
    $1,800
    $1,800
    $1,800
    $1,800
    $1,800
    Insurance
    $600
    $600
    $600
    $600
    $600
    $600
    $600
    $600
    $600
    $600
    $600
    $600
    $600
    $600
    $600
    $600
    $600
    $600
    $600
    $600
    $600
    $600
    $600
    $600
    $600
    $600
    $600
    $600
    $600
    $600
    Maintenance Assumption
    $1,005
    $1,025
    $1,046
    $1,067
    $1,088
    $1,110
    $1,132
    $1,154
    $1,178
    $1,201
    $1,225
    $1,250
    $1,275
    $1,300
    $1,326
    $1,353
    $1,380
    $1,407
    $1,435
    $1,464
    $1,493
    $1,523
    $1,554
    $1,585
    $1,616
    $1,649
    $1,682
    $1,715
    $1,750
    $1,785
    Property Management
    $2,010
    $2,050
    $2,091
    $2,133
    $2,176
    $2,219
    $2,264
    $2,309
    $2,355
    $2,402
    $2,450
    $2,499
    $2,549
    $2,600
    $2,652
    $2,705
    $2,759
    $2,814
    $2,871
    $2,928
    $2,987
    $3,046
    $3,107
    $3,170
    $3,233
    $3,298
    $3,364
    $3,431
    $3,499
    $3,569
    Owner-Paid Utilities / Landscaping
    $0
    $0
    $0
    $0
    $0
    $0
    $0
    $0
    $0
    $0
    $0
    $0
    $0
    $0
    $0
    $0
    $0
    $0
    $0
    $0
    $0
    $0
    $0
    $0
    $0
    $0
    $0
    $0
    $0
    $0
    Other Expense
    $0
    $0
    $0
    $0
    $0
    $0
    $0
    $0
    $0
    $0
    $0
    $0
    $0
    $0
    $0
    $0
    $0
    $0
    $0
    $0
    $0
    $0
    $0
    $0
    $0
    $0
    $0
    $0
    $0
    $0
    Total Operating Expenses
    $5,415
    $5,475
    $5,537
    $5,600
    $5,664
    $5,729
    $5,795
    $5,863
    $5,933
    $6,003
    $6,075
    $6,149
    $6,224
    $6,300
    $6,378
    $6,458
    $6,539
    $6,622
    $6,706
    $6,792
    $6,880
    $6,970
    $7,061
    $7,154
    $7,249
    $7,346
    $7,445
    $7,546
    $7,649
    $7,754
    Annual Debt Service
    Year 1Year 2Year 3Year 4Year 5Year 6Year 7Year 8Year 9Year 10Year 11Year 12Year 13Year 14Year 15Year 16Year 17Year 18Year 19Year 20Year 21Year 22Year 23Year 24Year 25Year 26Year 27Year 28Year 29Year 30
    Debt Service
    $10,049
    $10,049
    $10,049
    $10,049
    $10,049
    $10,049
    $10,049
    $10,049
    $10,049
    $10,049
    $10,049
    $10,049
    $10,049
    $10,049
    $10,049
    $10,049
    $10,049
    $10,049
    $10,049
    $10,049
    $10,049
    $10,049
    $10,049
    $10,049
    $10,049
    $10,049
    $10,049
    $10,049
    $10,049
    $10,049
    Mortgage Balance at Year End
    $153,698
    $151,279
    $148,736
    $146,063
    $143,253
    $140,299
    $137,194
    $133,931
    $130,500
    $126,894
    $123,103
    $119,118
    $114,930
    $110,527
    $105,899
    $101,034
    $95,920
    $90,545
    $84,895
    $78,955
    $72,712
    $66,149
    $59,251
    $51,999
    $44,377
    $36,364
    $27,942
    $19,089
    $9,782
    -
    Debt Service Coverage Ratio
    1.32%
    1.35%
    1.38%
    1.42%
    1.45%
    1.48%
    1.52%
    1.55%
    1.59%
    1.63%
    1.66%
    1.7%
    1.74%
    1.78%
    1.82%
    1.86%
    1.9%
    1.95%
    1.99%
    2.03%
    2.08%
    2.13%
    2.17%
    2.22%
    2.27%
    2.32%
    2.37%
    2.42%
    2.48%
    2.53%
    Annual Capital Improvements
    Year 1Year 2Year 3Year 4Year 5Year 6Year 7Year 8Year 9Year 10Year 11Year 12Year 13Year 14Year 15Year 16Year 17Year 18Year 19Year 20Year 21Year 22Year 23Year 24Year 25Year 26Year 27Year 28Year 29Year 30
    Capital Improvements
    $0
    $0
    $0
    $0
    $0
    $0
    $0
    $0
    $0
    $0
    $0
    $0
    $0
    $0
    $0
    $0
    $0
    $0
    $0
    $0
    $0
    $0
    $0
    $0
    $0
    $0
    $0
    $0
    $0
    $0
    Annual Cash Flow Analysis
    Year 1Year 2Year 3Year 4Year 5Year 6Year 7Year 8Year 9Year 10Year 11Year 12Year 13Year 14Year 15Year 16Year 17Year 18Year 19Year 20Year 21Year 22Year 23Year 24Year 25Year 26Year 27Year 28Year 29Year 30
    Net Operating Income
    $13,278
    $13,592
    $13,911
    $14,238
    $14,570
    $14,910
    $15,256
    $15,609
    $15,969
    $16,337
    $16,711
    $17,094
    $17,483
    $17,881
    $18,287
    $18,701
    $19,123
    $19,553
    $19,992
    $20,440
    $20,897
    $21,363
    $21,838
    $22,323
    $22,817
    $23,321
    $23,836
    $24,361
    $24,896
    $25,442
    Capitalization Rate
    6.8%
    7%
    7.1%
    7.3%
    7.5%
    7.6%
    7.8%
    8%
    8.2%
    8.4%
    8.6%
    8.8%
    9%
    9.2%
    9.4%
    9.6%
    9.8%
    10%
    10.3%
    10.5%
    10.7%
    11%
    11.2%
    11.4%
    11.7%
    12%
    12.2%
    12.5%
    12.8%
    13%
    Cash Flow Before Taxes
    $3,229
    $3,542
    $3,862
    $4,188
    $4,521
    $4,860
    $5,207
    $5,560
    $5,920
    $6,287
    $6,662
    $7,044
    $7,434
    $7,832
    $8,237
    $8,651
    $9,073
    $9,504
    $9,943
    $10,391
    $10,847
    $11,313
    $11,789
    $12,273
    $12,768
    $13,272
    $13,787
    $14,311
    $14,846
    $15,392
    Cash on Cash Return
    7.2%
    7.9%
    8.6%
    9.3%
    10%
    10.8%
    11.6%
    12.4%
    13.2%
    14%
    14.8%
    15.7%
    16.5%
    17.4%
    18.3%
    19.2%
    20.2%
    21.1%
    22.1%
    23.1%
    24.1%
    25.1%
    26.2%
    27.3%
    28.4%
    29.5%
    30.6%
    31.8%
    33%
    34.2%
    Annual Equity Accumulation
    Year 1Year 2Year 3Year 4Year 5Year 6Year 7Year 8Year 9Year 10Year 11Year 12Year 13Year 14Year 15Year 16Year 17Year 18Year 19Year 20Year 21Year 22Year 23Year 24Year 25Year 26Year 27Year 28Year 29Year 30
    Property Appreciation
    $7,800
    $8,112
    $8,436
    $8,774
    $9,125
    $9,490
    $9,869
    $10,264
    $10,675
    $11,102
    $11,546
    $12,008
    $12,488
    $12,988
    $13,507
    $14,047
    $14,609
    $15,194
    $15,801
    $16,433
    $17,091
    $17,774
    $18,485
    $19,225
    $19,994
    $20,794
    $21,625
    $22,490
    $23,390
    $24,325
    Mortgage Principal Pay Down
    $2,302
    $2,419
    $2,543
    $2,673
    $2,810
    $2,954
    $3,105
    $3,264
    $3,431
    $3,606
    $3,791
    $3,985
    $4,189
    $4,403
    $4,628
    $4,865
    $5,114
    $5,375
    $5,650
    $5,939
    $6,243
    $6,563
    $6,899
    $7,251
    $7,622
    $8,012
    $8,422
    $8,853
    $9,306
    $9,782
    Total Equity Growth
    $10,102
    $10,531
    $10,980
    $11,447
    $11,935
    $12,444
    $12,974
    $13,528
    $14,106
    $14,708
    $15,337
    $15,992
    $16,677
    $17,390
    $18,135
    $18,912
    $19,723
    $20,569
    $21,452
    $22,373
    $23,334
    $24,337
    $25,384
    $26,476
    $27,616
    $28,806
    $30,048
    $31,344
    $32,696
    $34,108
    Annual Tax Savings From Depreciation
    Year 1Year 2Year 3Year 4Year 5Year 6Year 7Year 8Year 9Year 10Year 11Year 12Year 13Year 14Year 15Year 16Year 17Year 18Year 19Year 20Year 21Year 22Year 23Year 24Year 25Year 26Year 27Year 28Year 29Year 30
    Straight Line Depreciation of Cost Basis
    $6,591
    $6,591
    $6,591
    $6,591
    $6,591
    $6,591
    $6,591
    $6,591
    $6,591
    $6,591
    $6,591
    $6,591
    $6,591
    $6,591
    $6,591
    $6,591
    $6,591
    $6,591
    $6,591
    $6,591
    $6,591
    $6,591
    $6,591
    $6,591
    $6,591
    $6,591
    $6,591
    $3,295
    $0
    $0
    Straight Line Depreciaiton of Lender Fees / Points
    $100
    $100
    $100
    $100
    $100
    $100
    $100
    $100
    $100
    $100
    $100
    $100
    $100
    $100
    $100
    $100
    $100
    $100
    $100
    $100
    $100
    $100
    $100
    $100
    $100
    $100
    $100
    $100
    $100
    $100
    Total Straight Line Depreciation
    $6,691
    $6,691
    $6,691
    $6,691
    $6,691
    $6,691
    $6,691
    $6,691
    $6,691
    $6,691
    $6,691
    $6,691
    $6,691
    $6,691
    $6,691
    $6,691
    $6,691
    $6,691
    $6,691
    $6,691
    $6,691
    $6,691
    $6,691
    $6,691
    $6,691
    $6,691
    $6,691
    $3,395
    $100
    $100
    Taxable Income Before Depreciation
    $5,530
    $5,962
    $6,405
    $6,862
    $7,331
    $7,814
    $8,312
    $8,824
    $9,351
    $9,894
    $10,453
    $11,029
    $11,623
    $12,235
    $12,866
    $13,516
    $14,187
    $14,879
    $15,593
    $16,330
    $17,091
    $17,876
    $18,687
    $19,525
    $20,390
    $21,285
    $22,209
    $23,165
    $24,153
    $25,175
    Carry Forward Loss From Depreciation
    $1,161
    $1,890
    $2,176
    $2,005
    $1,365
    $242
    $0
    $0
    $0
    $0
    $0
    $0
    $0
    $0
    $0
    $0
    $0
    $0
    $0
    $0
    $0
    $0
    $0
    $0
    $0
    $0
    $0
    $0
    $0
    $0
    Taxable Income Offset by Depreciation
    $5,530
    $5,962
    $6,405
    $6,862
    $7,331
    $7,814
    $6,933
    $6,691
    $6,691
    $6,691
    $6,691
    $6,691
    $6,691
    $6,691
    $6,691
    $6,691
    $6,691
    $6,691
    $6,691
    $6,691
    $6,691
    $6,691
    $6,691
    $6,691
    $6,691
    $6,691
    $6,691
    $3,395
    $100
    $100
    Remaining Taxable Income After Depreciation
    $0
    $0
    $0
    $0
    $0
    $0
    $1,379
    $2,133
    $2,660
    $3,203
    $3,762
    $4,338
    $4,932
    $5,544
    $6,175
    $6,825
    $7,496
    $8,188
    $8,902
    $9,639
    $10,400
    $11,185
    $11,996
    $12,834
    $13,699
    $14,594
    $15,518
    $19,769
    $24,053
    $25,075
    Federal Income Tax Owed on Rental Income
    $0
    $0
    $0
    $0
    $0
    $0
    $441
    $682
    $851
    $1,025
    $1,204
    $1,388
    $1,578
    $1,774
    $1,976
    $2,184
    $2,399
    $2,620
    $2,849
    $3,085
    $3,328
    $3,579
    $3,839
    $4,107
    $4,384
    $4,670
    $4,966
    $6,326
    $7,697
    $8,024
    Tax Savings from Depreciation
    $1,770
    $1,908
    $2,050
    $2,196
    $2,346
    $2,501
    $2,218
    $2,141
    $2,141
    $2,141
    $2,141
    $2,141
    $2,141
    $2,141
    $2,141
    $2,141
    $2,141
    $2,141
    $2,141
    $2,141
    $2,141
    $2,141
    $2,141
    $2,141
    $2,141
    $2,141
    $2,141
    $1,087
    $32
    $32
    Cash Flow After Taxes
    $3,229
    $3,542
    $3,862
    $4,188
    $4,521
    $4,860
    $4,765
    $4,877
    $5,069
    $5,263
    $5,458
    $5,656
    $5,856
    $6,058
    $6,262
    $6,467
    $6,674
    $6,883
    $7,094
    $7,306
    $7,519
    $7,734
    $7,950
    $8,166
    $8,384
    $8,602
    $8,821
    $7,985
    $7,150
    $7,368
    Performance Over Time
    Year 1Year 2Year 3Year 4Year 5Year 6Year 7Year 8Year 9Year 10Year 11Year 12Year 13Year 14Year 15Year 16Year 17Year 18Year 19Year 20Year 21Year 22Year 23Year 24Year 25Year 26Year 27Year 28Year 29Year 30
    Fair Market Property Value at Year End
    $202,800
    $210,912
    $219,348
    $228,122
    $237,247
    $246,737
    $256,607
    $266,871
    $277,546
    $288,648
    $300,194
    $312,201
    $324,689
    $337,677
    $351,184
    $365,231
    $379,841
    $395,034
    $410,836
    $427,269
    $444,360
    $462,134
    $480,620
    $499,844
    $519,838
    $540,632
    $562,257
    $584,747
    $608,137
    $632,463
    Cumulative Appreciation
    $7,800
    $15,912
    $24,348
    $33,122
    $42,247
    $51,737
    $61,607
    $71,871
    $82,546
    $93,648
    $105,194
    $117,201
    $129,689
    $142,677
    $156,184
    $170,231
    $184,841
    $200,034
    $215,836
    $232,269
    $249,360
    $267,134
    $285,620
    $304,844
    $324,838
    $345,632
    $367,257
    $389,747
    $413,137
    $437,463
    Cumulative Mortgage Principal Paydown
    $2,302
    $4,721
    $7,264
    $9,937
    $12,747
    $15,701
    $18,806
    $22,069
    $25,500
    $29,106
    $32,897
    $36,882
    $41,070
    $45,473
    $50,101
    $54,966
    $60,080
    $65,455
    $71,105
    $77,045
    $83,288
    $89,851
    $96,749
    $104,001
    $111,623
    $119,636
    $128,058
    $136,911
    $146,218
    $156,000
    Total Cumulative Equity
    $49,102
    $59,633
    $70,612
    $82,060
    $93,994
    $106,438
    $119,412
    $132,940
    $147,046
    $161,754
    $177,091
    $193,083
    $209,760
    $227,150
    $245,285
    $264,197
    $283,920
    $304,489
    $325,941
    $348,314
    $371,648
    $395,985
    $421,369
    $447,845
    $475,461
    $504,267
    $534,315
    $565,659
    $598,355
    $632,463
    Cumulative Cash Flow Before Taxes
    $3,229
    $6,771
    $10,633
    $14,821
    $19,342
    $24,203
    $29,410
    $34,969
    $40,889
    $47,177
    $53,839
    $60,883
    $68,317
    $76,149
    $84,387
    $93,038
    $102,111
    $111,615
    $121,558
    $131,948
    $142,796
    $154,109
    $165,897
    $178,171
    $190,939
    $204,211
    $217,997
    $232,308
    $247,155
    $262,547
    Cumulative Tax Savings From Depreciation
    $1,770
    $3,677
    $5,727
    $7,923
    $10,269
    $12,769
    $14,988
    $17,129
    $19,270
    $21,411
    $23,552
    $25,693
    $27,834
    $29,975
    $32,116
    $34,257
    $36,399
    $38,540
    $40,681
    $42,822
    $44,963
    $47,104
    $49,245
    $51,386
    $53,527
    $55,668
    $57,809
    $58,896
    $58,928
    $58,960
    Cumulative Cash Flow After Taxes
    $3,229
    $6,771
    $10,633
    $14,821
    $19,342
    $24,203
    $28,968
    $33,846
    $38,915
    $44,177
    $49,635
    $55,291
    $61,147
    $67,205
    $73,467
    $79,934
    $86,609
    $93,492
    $100,586
    $107,892
    $115,412
    $123,146
    $131,096
    $139,262
    $147,646
    $156,248
    $165,069
    $173,054
    $180,204
    $187,572
    Total Net Profit if Sold
    -
    $4,531
    $18,698
    $33,631
    $49,357
    $65,902
    $82,852
    $100,436
    $118,757
    $137,839
    $157,710
    $178,398
    $199,932
    $222,341
    $245,657
    $269,913
    $295,142
    $321,379
    $348,660
    $377,025
    $406,511
    $437,160
    $469,015
    $502,120
    $536,520
    $572,265
    $609,403
    $646,933
    $684,907
    $724,438
    Total Return on Investment if Sold
    -
    10.07%
    41.55%
    74.74%
    109.68%
    146.45%
    184.12%
    223.19%
    263.9%
    306.31%
    350.47%
    396.44%
    444.29%
    494.09%
    545.91%
    599.81%
    655.87%
    714.17%
    774.8%
    837.83%
    903.36%
    971.47%
    1042.26%
    1115.82%
    1192.27%
    1271.7%
    1354.23%
    1437.63%
    1522.02%
    1609.86%
    Before-Tax Return on Investment if Held
    29.6%
    31.3%
    33%
    34.7%
    36.6%
    38.5%
    40.4%
    42.4%
    44.5%
    46.7%
    48.9%
    51.2%
    53.6%
    56%
    58.6%
    61.3%
    64%
    66.8%
    69.8%
    72.8%
    76%
    79.2%
    82.6%
    86.1%
    89.7%
    93.5%
    97.4%
    101.5%
    105.7%
    110%
    After-Tax Return on Investment if Held
    29.6%
    31.3%
    33%
    34.7%
    36.6%
    38.5%
    39.4%
    40.9%
    42.6%
    44.4%
    46.2%
    48.1%
    50.1%
    52.1%
    54.2%
    56.4%
    58.7%
    61%
    63.4%
    66%
    68.6%
    71.3%
    74.1%
    77%
    80%
    83.1%
    86.4%
    87.4%
    88.5%
    92.2%
    Internal Rate of Return (IRR)
    -
    5.1%
    13.1%
    16.3%
    17.7%
    18.3%
    18.5%
    18.5%
    18.4%
    18.2%
    18%
    17.8%
    17.6%
    17.3%
    17.1%
    16.9%
    16.7%
    16.5%
    16.3%
    16.2%
    16%
    15.8%
    15.7%
    15.6%
    15.4%
    15.3%
    15.2%
    15.1%
    15%
    14.9%