Own Cash-Flowing Rental Properties in the Best U.S. Markets From Anywhere!

Search
Close this search box.

Welcome to Southwest Florida!

ABOUT Southwest Florida

Southwest Florida contains two Large MSAs that are both booming with population growth and home price appreciation! The Cape Coral-Fort Myers MSA saw a population increase of 22% in less than a decade which ranked it #7 in the U.S. before the pandemic (source: US Census).  Now, remote workers as well as retirees are all flocking in for the sun, golf and lifestyle as Cape Coral was ranked #1 Happiest City in America (source: Wallethub). As a result, both rents and home prices have been shooting up, with over 85% home price appreciation in the last 5 years!  Right next door is the North Port-Sarasota-Bradenton MSA, where home prices increased over 90% in the last 5 years. (Source: FHFA.gov) Both MSAs have unemployment rates well below the national average (Source BLS.gov) and are premium locations to own rental property directly in the path of growth.

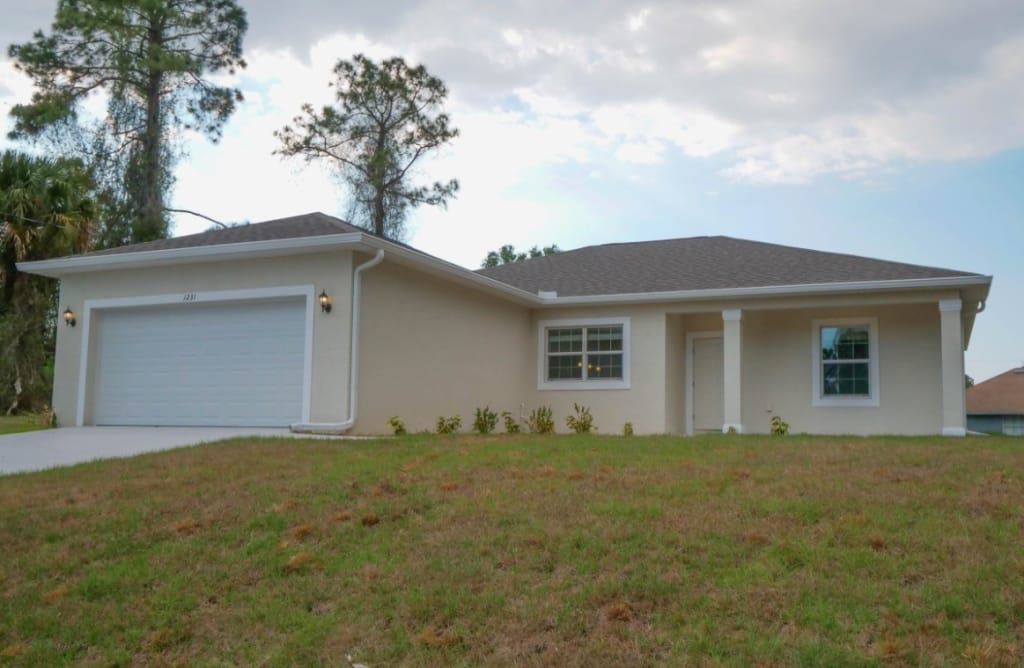
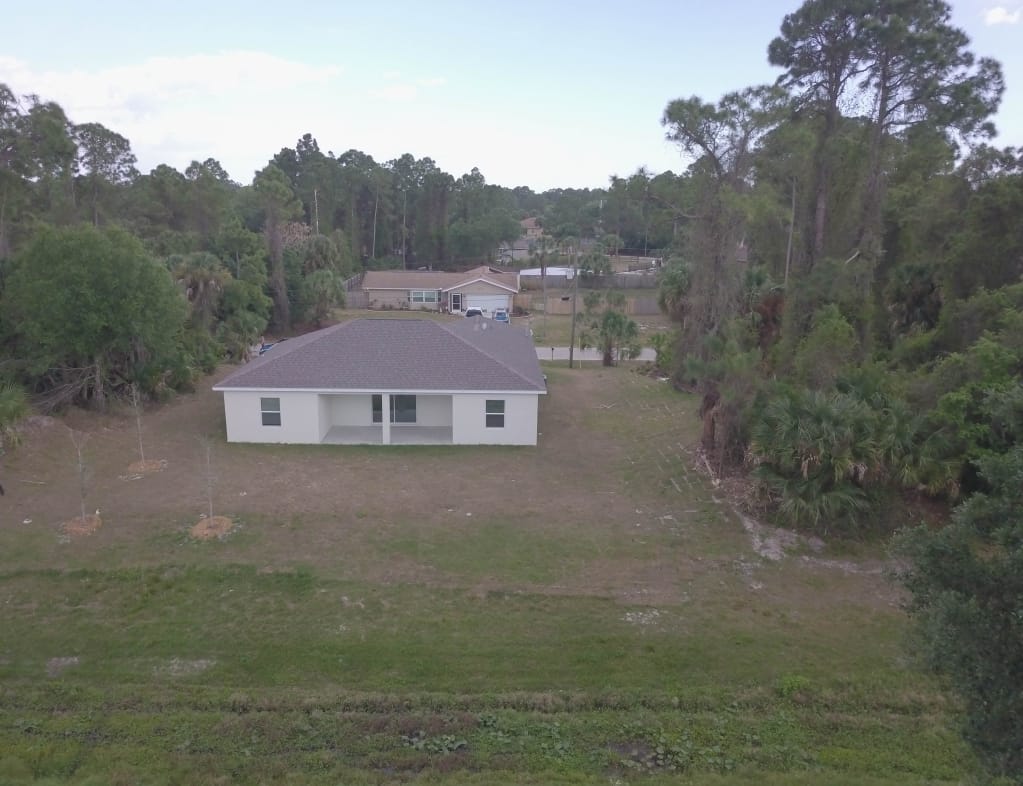
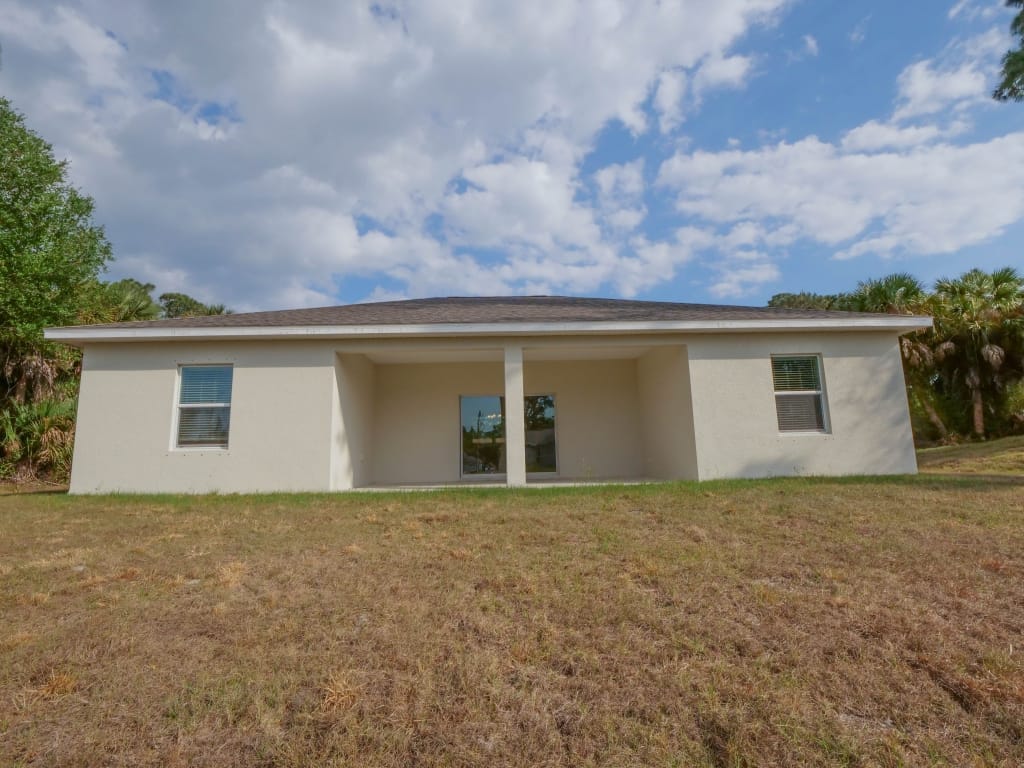
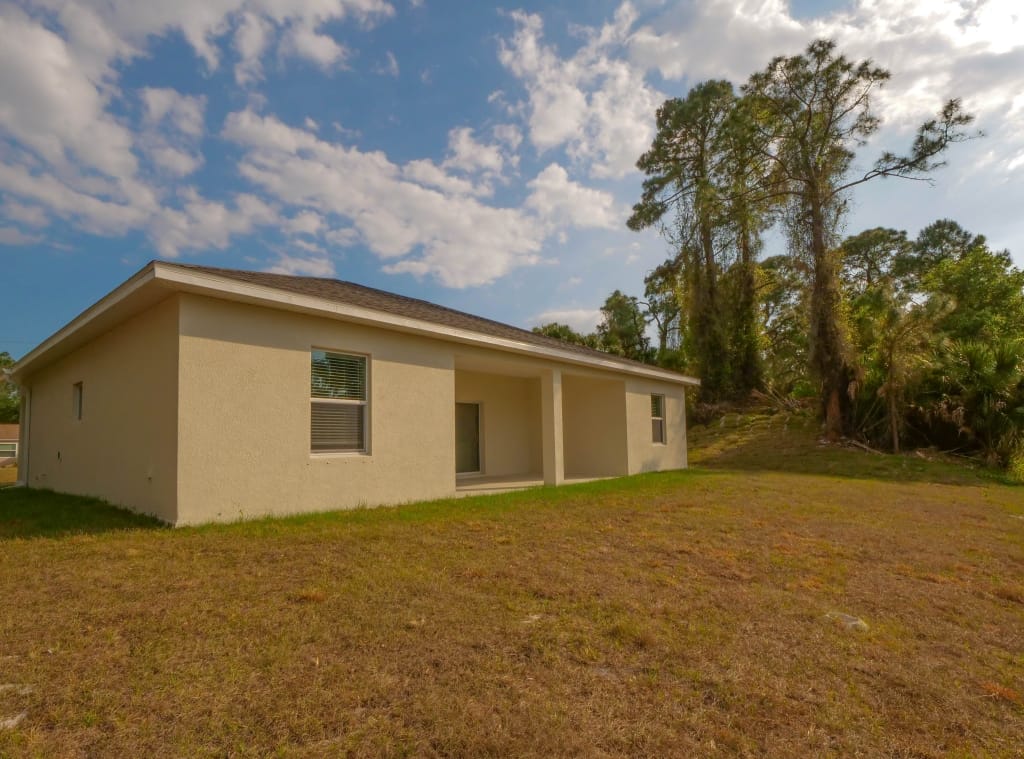
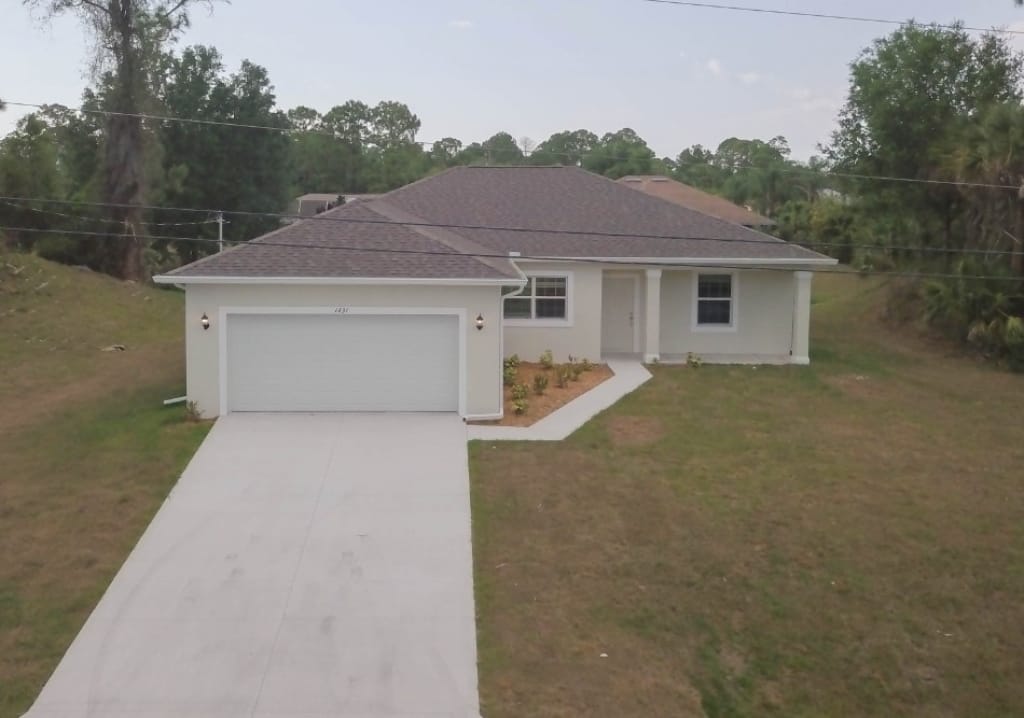
Trenton Lane North Port, FL

RESERVE THIS PROPERTY

OFFERED BY THE SELLER

  • 2 Free Years of Property Management (If you use the sellers preferred property management company)
  • 5.99% Mortgage (for qualified borrowers who use the seller’s preferred lenders)
  • 2-10 Builder Warranty

Snapshot Financials

Price:
$ 359000
Rent:
$ 2550 / mo
Taxes:

Estimated Property Taxes

$ 413
Insurance:

Estimated Insurance

$ 600
HOA Fee:

Home Owners Association Fee

$ 0
PM Fee:

Property Management Fee

$ 130
Other:
$ 0
Other:
$ 0
Vacancy:

Based on 5%

$ 127.5
Repairs:

Based on 4%

$ 102
Total:

Total Monthly Expenses

$ 822.5
NOI:

Monthly Net Operating Income ('NOI') = Monthly Gross Scheduled Rent - Monthly Operating Expenses - 5% Maintenance Estimate - 7% Vacancy Estimates. NOI does not take into account any financing that you may be using. The NOI is always an 'estimate' and can never be guaranteed because it includes the non-fixed variables of 'maintenance' and 'vacancy' which vary over time.

$ 1728 / mo
Cap Rate:

Capitalization Rate ('Cap Rate') = Annual Net Operating Income / Purchase Price. Cap Rate does not take into account any financing you may be using nor any closing costs you may be paying.

5.77 %
GRM:

Gross Rent Multiplier ('GRM') = Purchase Price / Annual Gross Scheduled Rent. GRM is only a price to rent ratio and does not take into account any operating expenses, financing, closing cost payments or maintenance and vacancy assumptions. And remember, GRM is like a golf score, the lower the better.
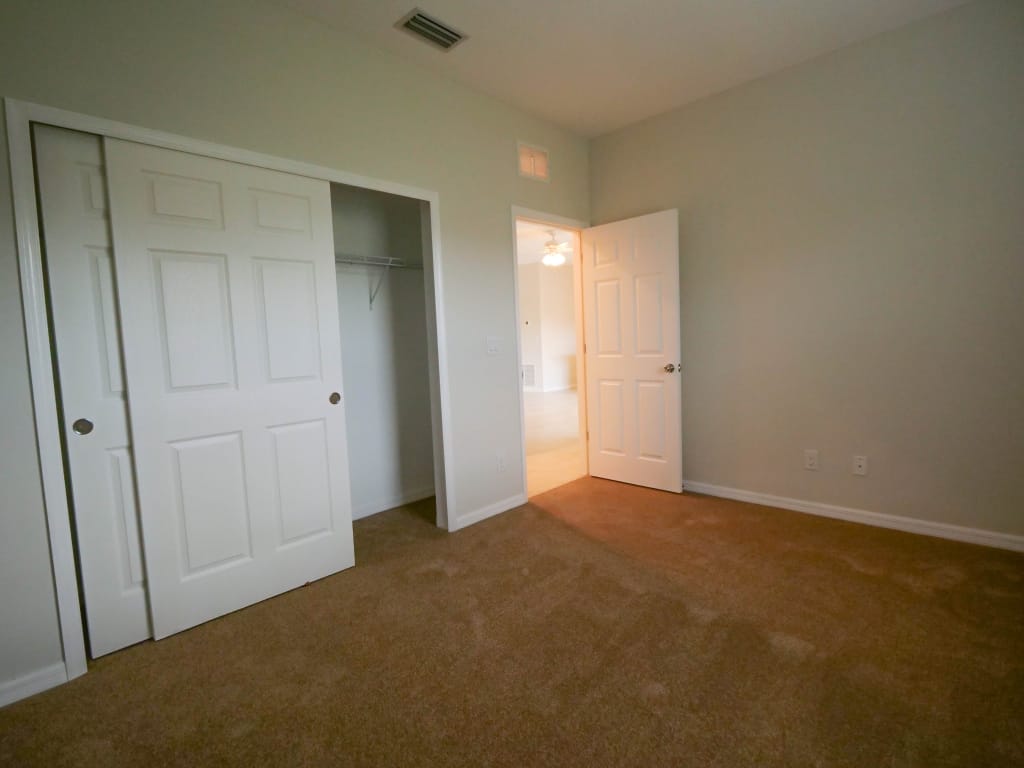
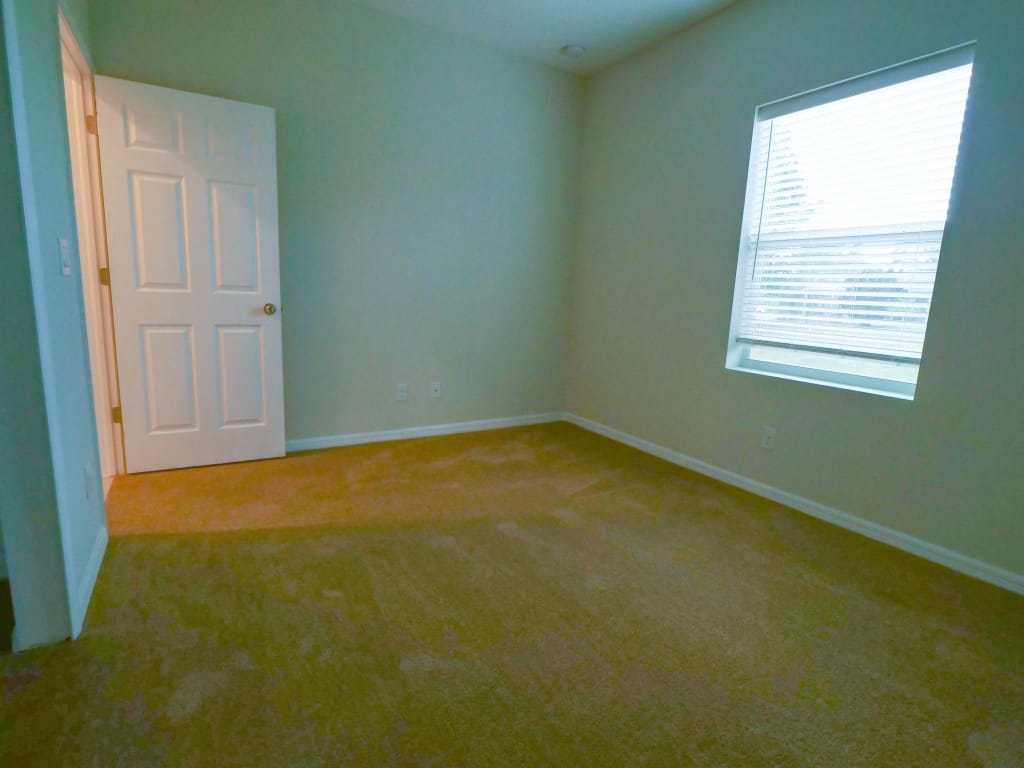
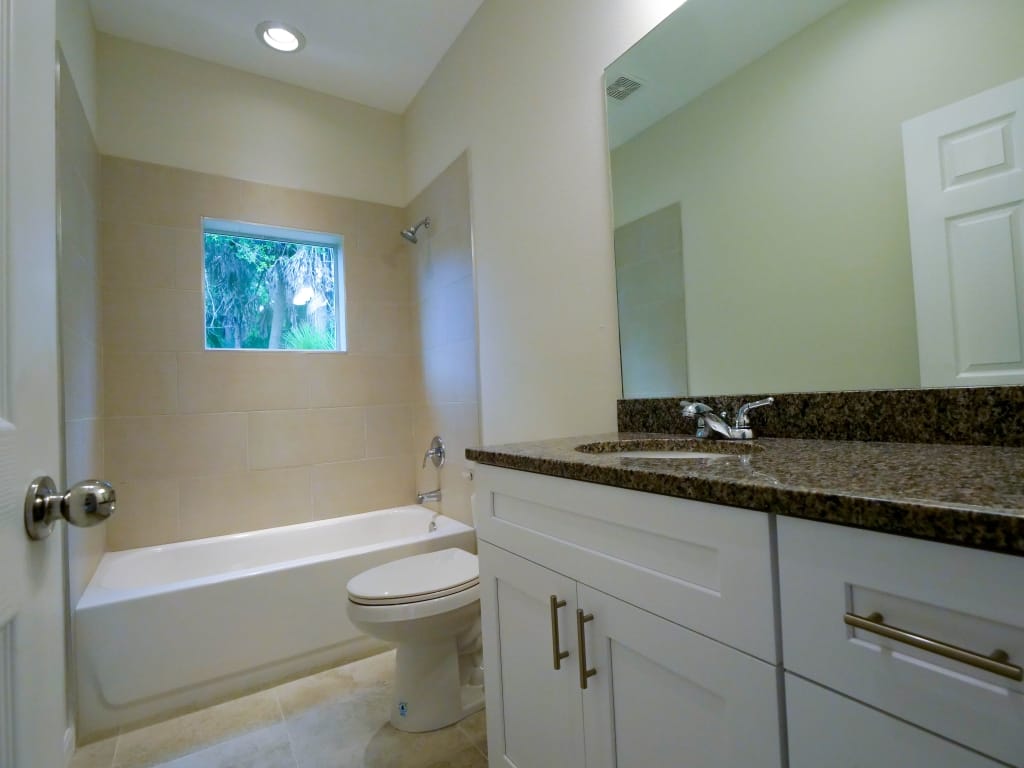
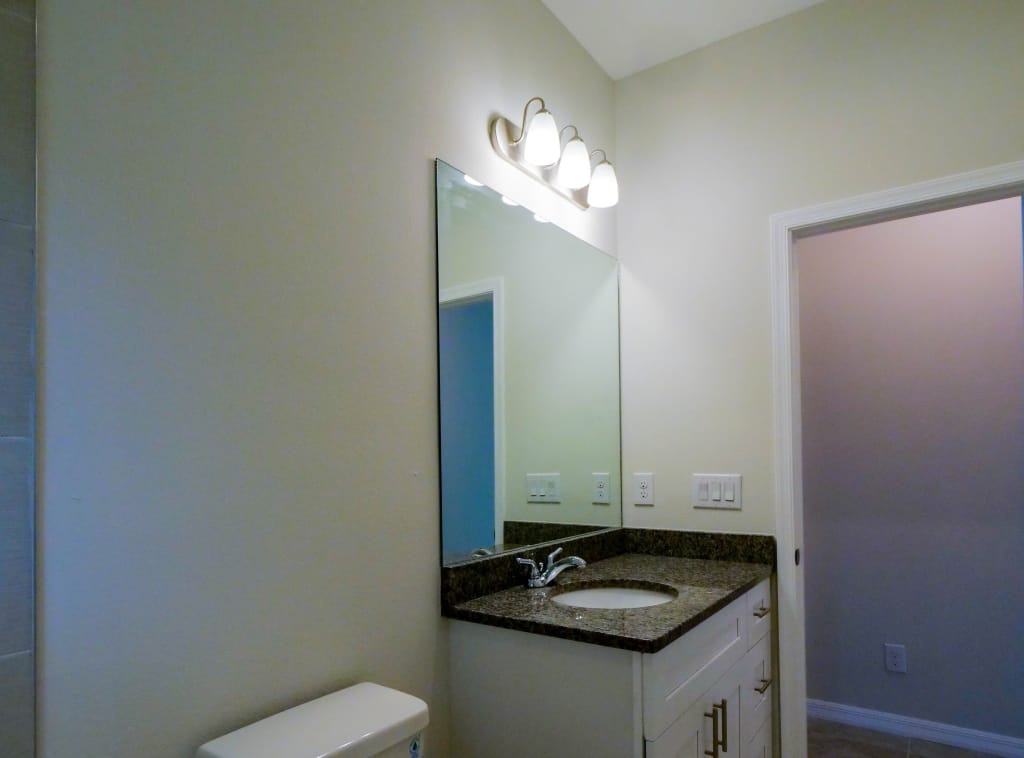
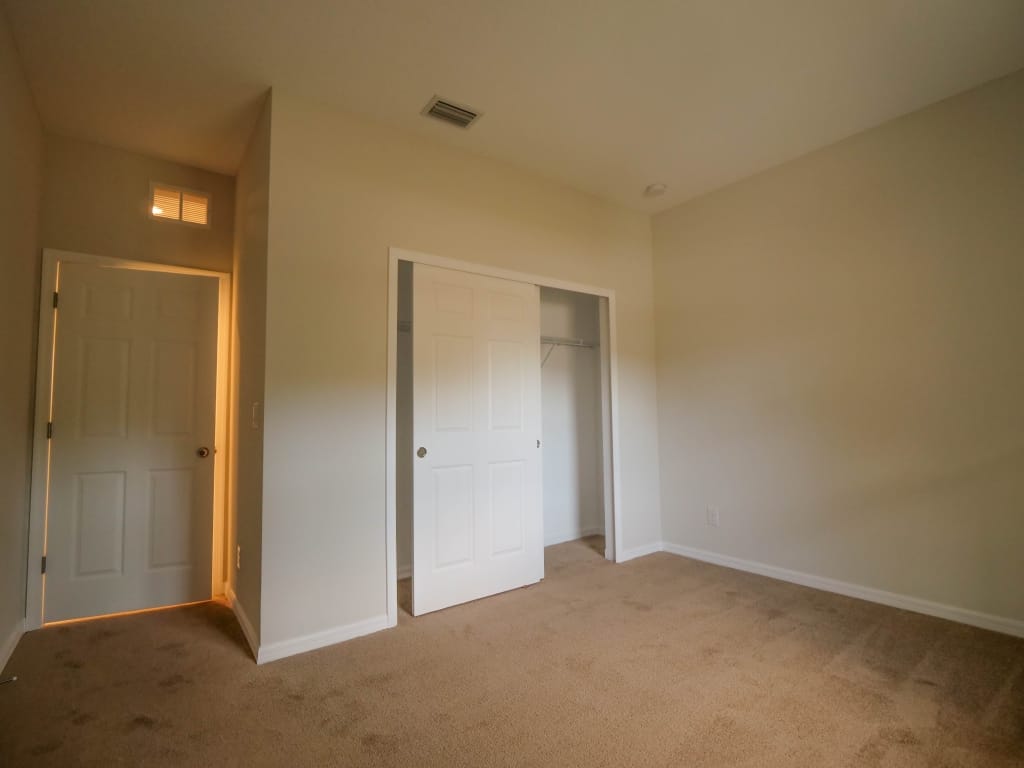
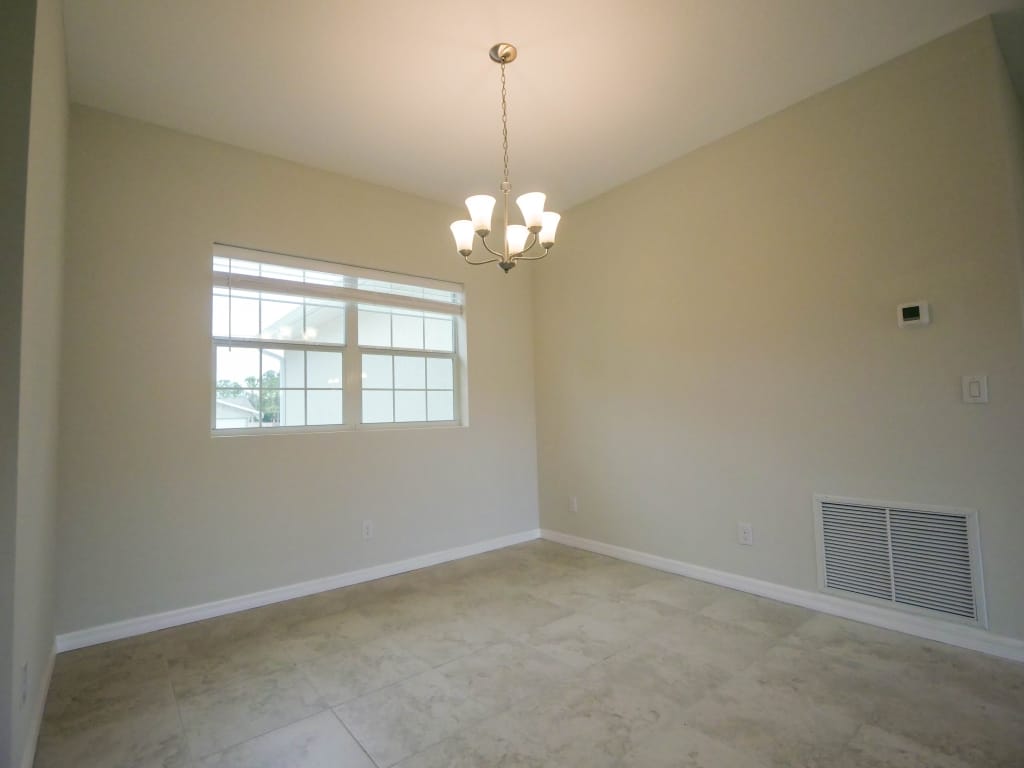
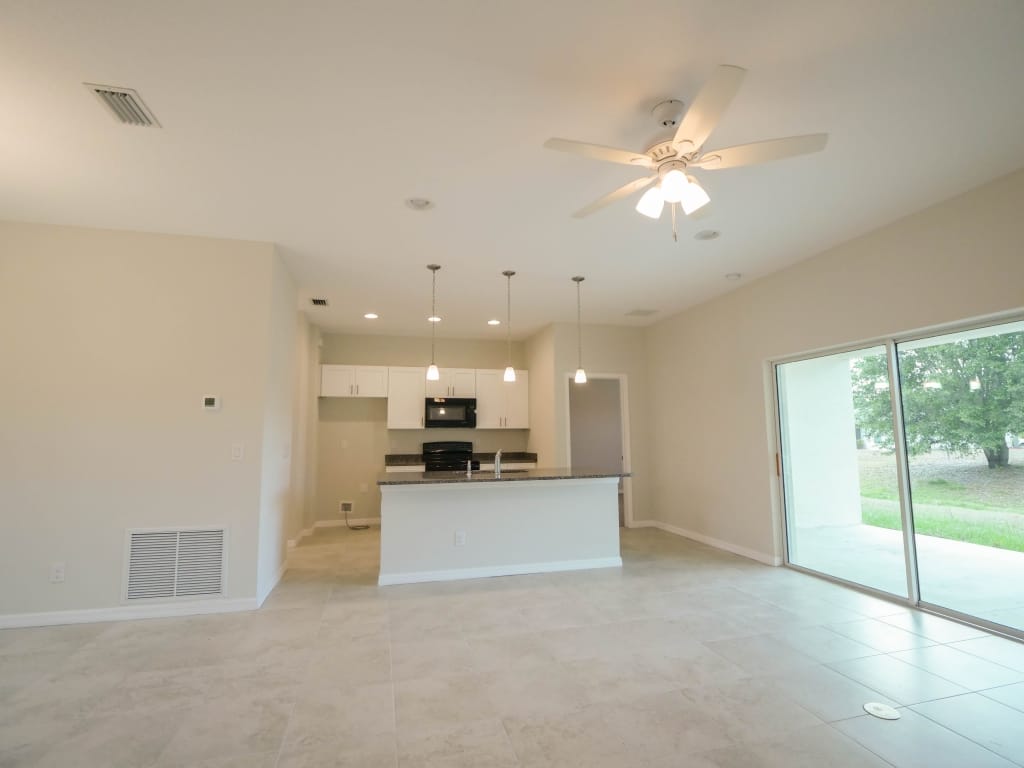
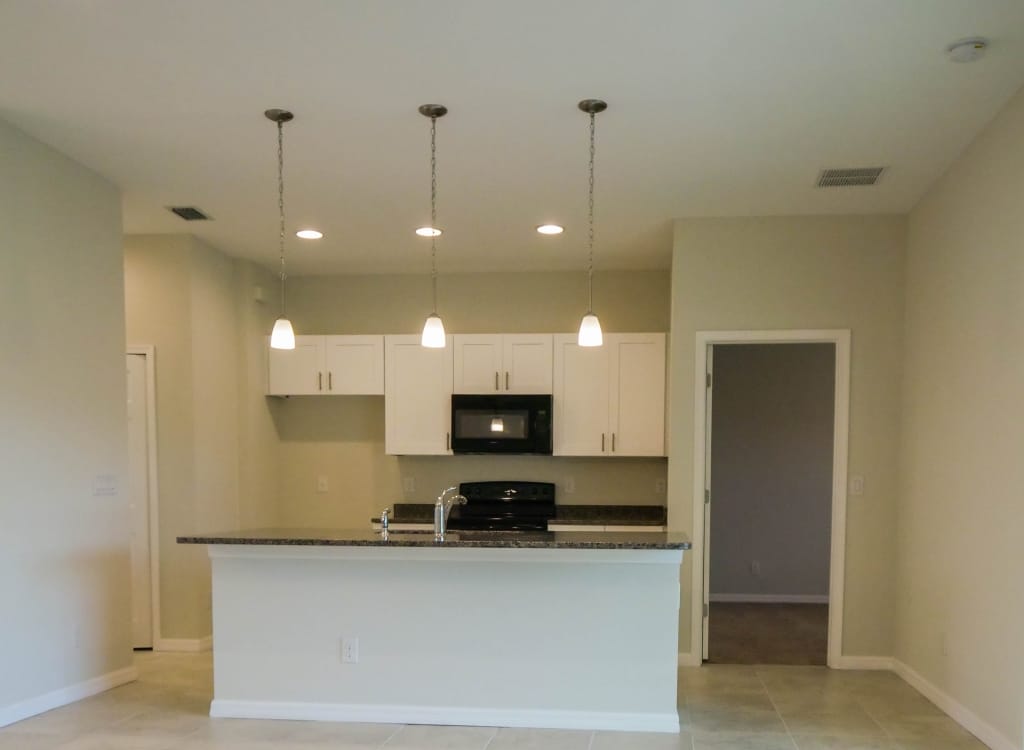
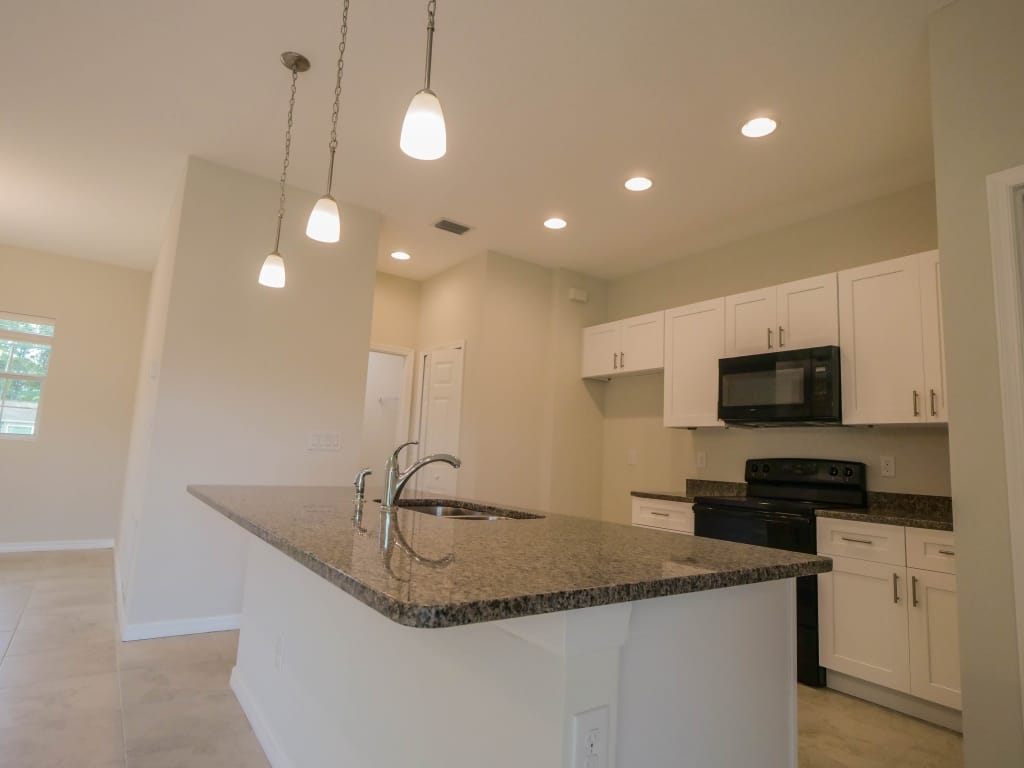
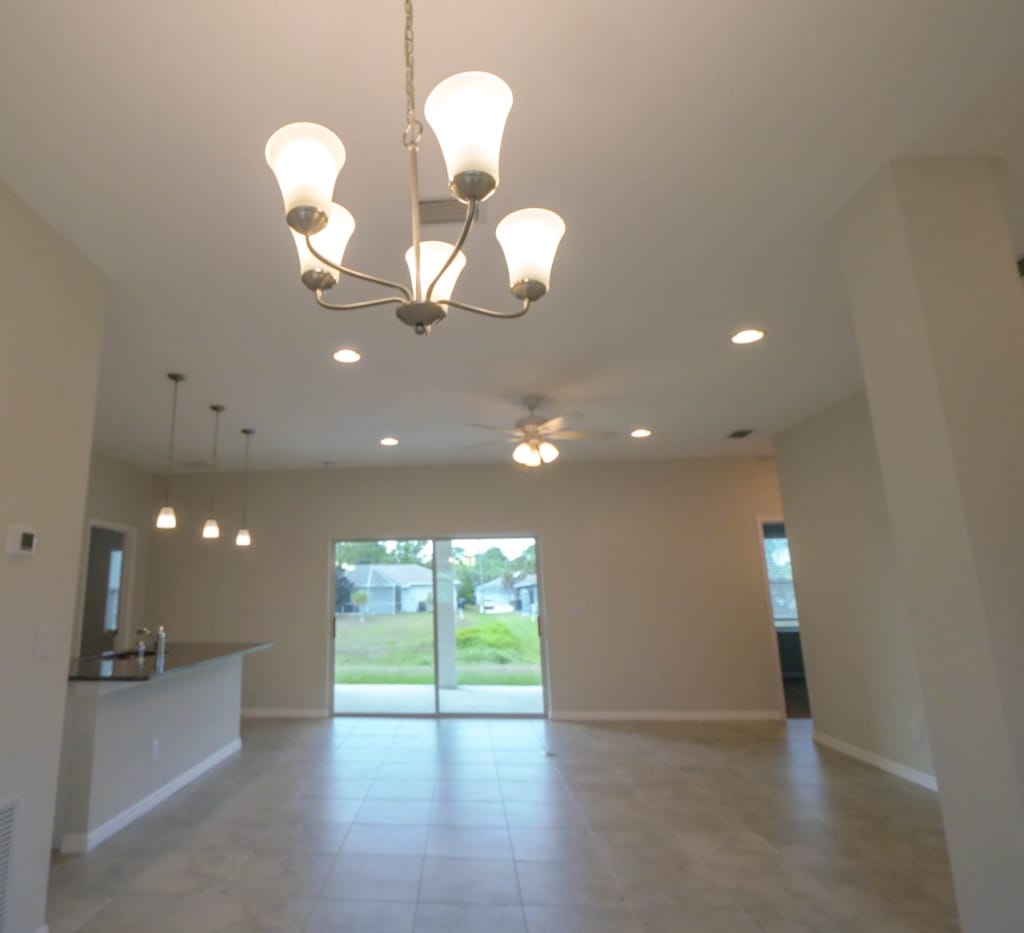
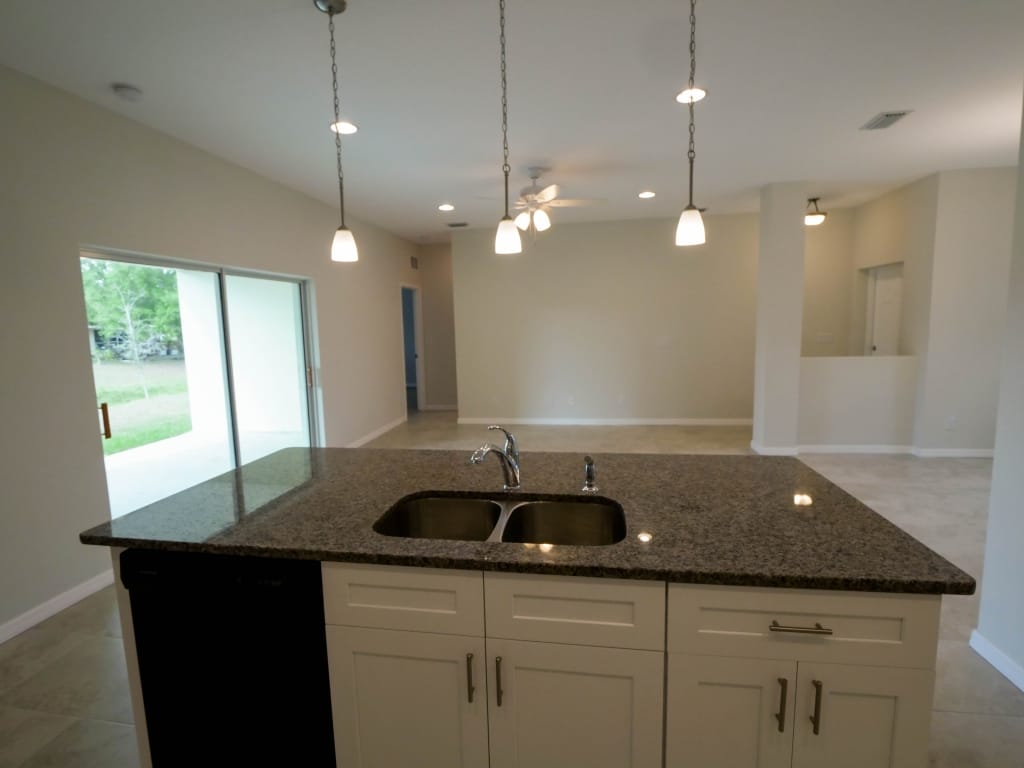
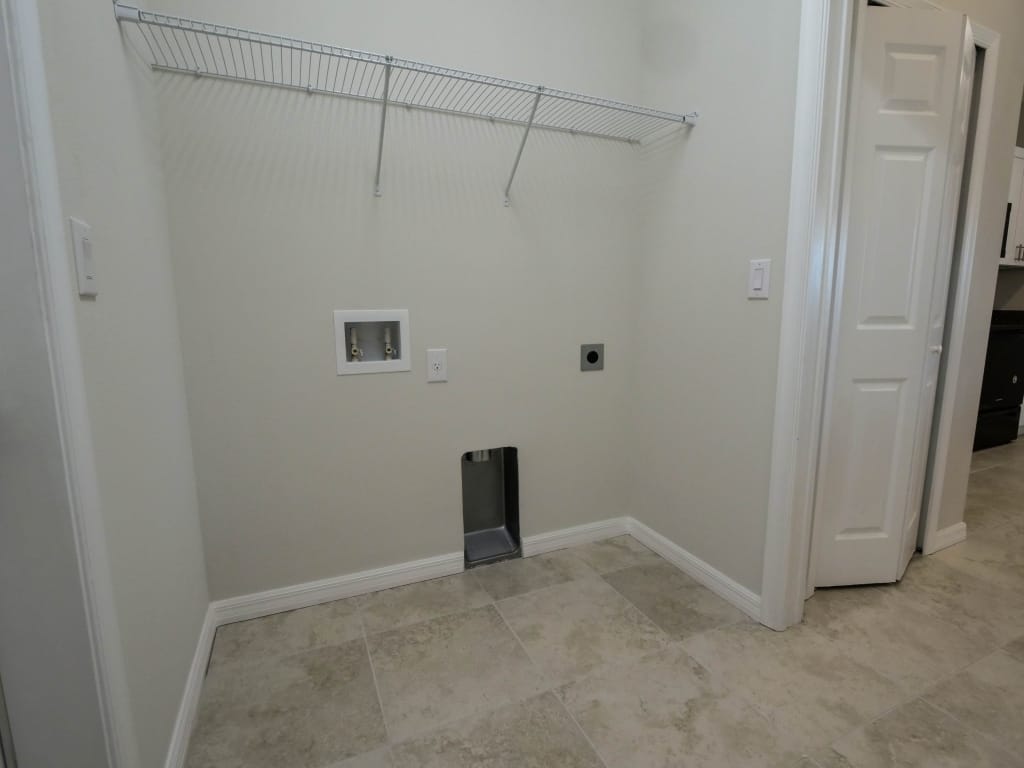
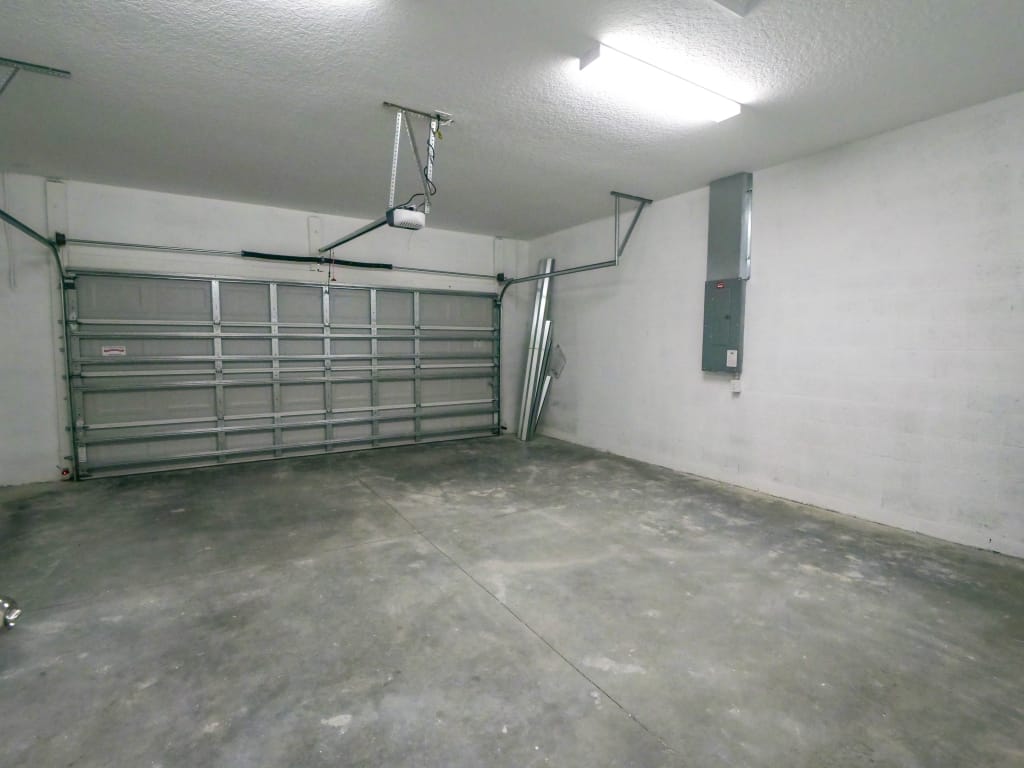
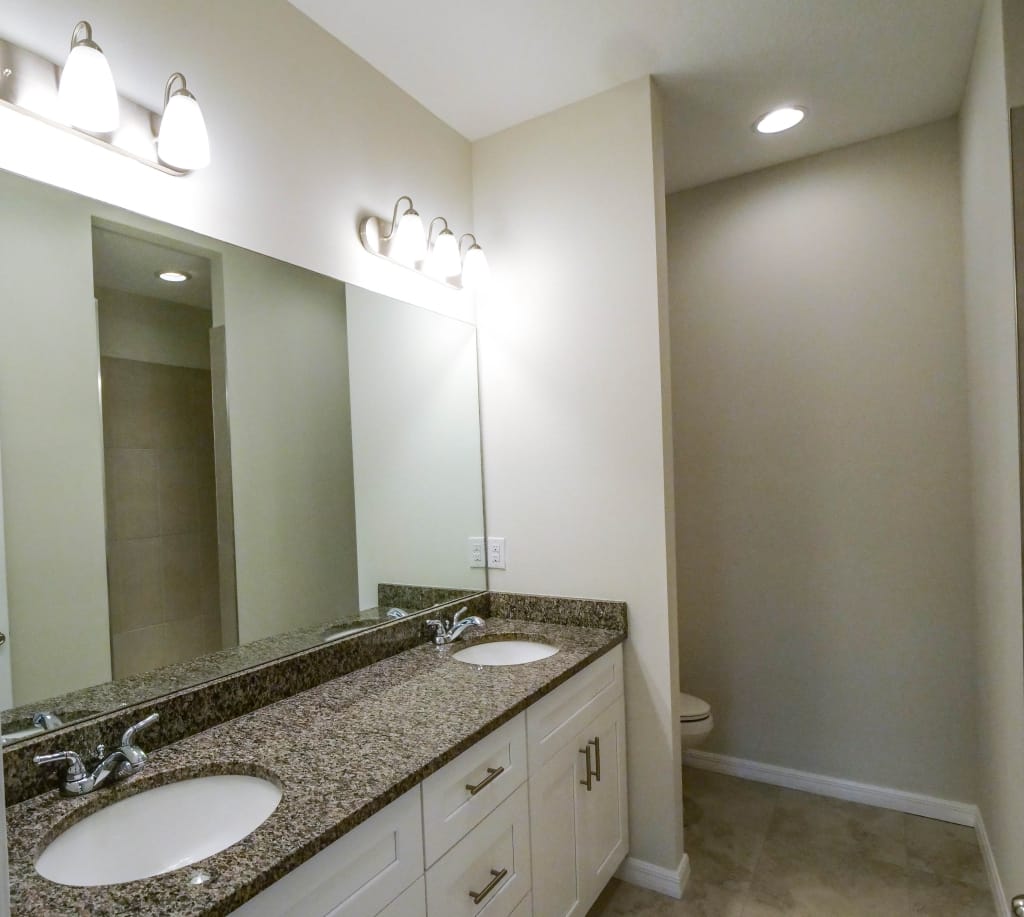
11.73

Property Features

Type:
Single Family Home
Condition:
New Construction
Rental Status:
Vacant
Year Built:
2022
Bedrooms:
3
Bathrooms:
2.0
Floor Area:
1548 Sq Ft
Lot Size:
n/a
Stories:
1 Story
Basement:
Unknown
Parking:
2 Car Garage
RESERVE THIS PROPERTY

Seller's Additional Notes

*This new construction property comes with a 2-10 Builder Warranty

*The Seller is willing to pay 2% of your loan amount towards your closing costs if you use their preferred lender (which you can use to buy down the mortgage rate to increase your cash flow).  

*The Seller is also willing to pay 2 years of your property management fee if you use their preferred property management company (after which point the monthly PM fee becomes 5% of the gross rent).  

Southwest Florida Highlights

Southwest Florida Properties:

  • New Construction Single Family Rental Properties and Duplexes
  • Established Communities
  • Granite Countertops, Stainless Steel Appliances and a 2-10 Builder Warranty
  • $400,000 Average SFR Purchase Price
  • 5% Average Cap Rate

Southwest Florida Market:

  • 85%+ Home Price Appreciation over the last 5 years in each MSA (Source: FHFA.gov)
  • 22% Population Growth in Cape Coral-Fort Myers MSA in less than a Decade (USCensus.gov)
  • 500%+ Home Price Appreciation in North Port-Sarasota-Bradenton MSA since 1991 (Source: FHFA.gov)
  • Cape Coral Rated #1 Happiest City in America (Source: WalletHub)

Similar
Properties

Maverick Property Vault

$1726 Net Operating Income
$1616 Net Operating Income

More Maverick Markets

Subscribe

    GET Access TO Private buying opportunities for TURNKEY Rental properies & EDUCATIONAL RESOURCES. READ OUR PRIVACY NOTICE & TERMS OF USE.

    Maverick's Cash-Flow Calculator

    DISCLAIMER
    OPEN

    This calculator is for recreational use only and is NOT financial or accounting software. There are a litany of variables that may be relevant to determining your individual tax obligations, financial performance and investment returns on a rental property that are NOT factored into this calculator. By using this calculator, you understand that the numbers herein are NOT specific projections of what your returns will actually be, and you agree that it is YOUR DUTY to consult with your own tax and financial professionals about the evaluation, risk assessment, realistic financial expectations, and actual tax obligations associated with any real estate investment. You also understand that ALL real estate investing involves risk, which buyer assumes 100%, and that no specific returns can ever be guaranteed by anyone.

    Top

    INSTRUCTIONS

    Click into any Investor INPUTS (THE ORANGE FIELDS) to modify.
    Click any field LABEL to view a definition.
    Click CALCULATE to update financial calculations on ALL TABS.
    Purchase
    Monthly Cashflow
    Tax Benefits
    Future Assumptions

    INSTRUCTIONS

    Click into any Investor INPUTS (THE ORANGE FIELDS) to modify.
    Click any field LABEL to view a definition.
    Click CALCULATE to update financial calculations on ALL TABS.
    Cash to Purchase
    Purchase Price
    $359,000
    Fair Market Value
    $359,000
    Down Payment Amount
    $71,800
    Depreciable Closing Costs
    $3,000
    Lender Fees / Points
    $3,000
    Total Cash Invested
    $77,800
    Total Equity at Purchase
    $71,800
    Morgage Calculation
    Loan Amount
    $287,200
    Monthly Mortgage Payment
    $1,542
    First Year Mortgage Principal Paid Down
    $4,237
    First Year Mortgage Interest Paid
    $14,264

    INSTRUCTIONS

    Click into any Investor INPUTS (THE ORANGE FIELDS) to modify.
    Click any field LABEL to view a definition.
    Click CALCULATE to update financial calculations on ALL TABS.
    First Year Monthly Cashflow
    Gross Scheduled Rent
    $2,550
    Vacancy Estimate
    $128
    Gross Operating Income
    $2,423
    Property Taxes
    $150
    Insurance
    $50
    Other Expense
    $0
    Owner-Paid Utilities / Landscaping
    $0
    Property Management Fee
    $255
    Maintenance Estimate
    $102
    Total Operating Expenses
    $557
    Net Operating Income (NOI)
    $1,866
    Mortgage Payment
    $1,542
    Cash Flow Before Taxes
    $324
    Gross Rent Multiplier (GRM)
    11.7
    Rent to Value Ratio (RV Ratio)
    0.7%
    Capitalization Rate (Cap Rate)
    6.2%
    Cash on Cash Return
    5%

    INSTRUCTIONS

    Click into any Investor INPUTS (THE ORANGE FIELDS) to modify.
    Click any field LABEL to view a definition.
    Click CALCULATE to update financial calculations on ALL TABS.
    Tax Benefits
    Value of (Non-Depreciable) Land
    $35,900
    Value of (Depreciable) Property Structure
    $323,100
    Depreciable "Cost Basis" at Purchase
    $326,100
    Annual Straight Line Depreciation of Cost Basis
    $11,858
    Annual Depreciation of Lender Fees / Costs
    $100
    First Year Total Depreciation
    $11,958
    First Year Taxable Income Before Depreciation
    $8,122
    First Year Taxable Income Offset by Depreciation
    $8,122
    First Year Remaining Taxable Income After Depreciation
    $0
    First Year Federal Income Taxes Owed on Rental Income
    $0
    First Year Tax Savings from Depreciation on Rental Income
    $2,599
    First Year Left Over Depreciation
    $3,836

    INSTRUCTIONS

    Click into any Investor INPUTS (THE ORANGE FIELDS) to modify.
    Click any field LABEL to view a definition.
    Click CALCULATE to update financial calculations on ALL TABS.
    (Swipe left or right to scroll horizontally)
    Annual Income
    Year 1Year 2Year 3Year 4Year 5Year 6Year 7Year 8Year 9Year 10Year 11Year 12Year 13Year 14Year 15Year 16Year 17Year 18Year 19Year 20Year 21Year 22Year 23Year 24Year 25Year 26Year 27Year 28Year 29Year 30
    Gross Scheduled Rent
    $30,600
    $31,212
    $31,836
    $32,473
    $33,122
    $33,785
    $34,461
    $35,150
    $35,853
    $36,570
    $37,301
    $38,047
    $38,808
    $39,584
    $40,376
    $41,184
    $42,007
    $42,847
    $43,704
    $44,578
    $45,470
    $46,379
    $47,307
    $48,253
    $49,218
    $50,203
    $51,207
    $52,231
    $53,275
    $54,341
    Vacancy Loss
    $1,530
    $1,561
    $1,592
    $1,624
    $1,656
    $1,689
    $1,723
    $1,757
    $1,793
    $1,828
    $1,865
    $1,902
    $1,940
    $1,979
    $2,019
    $2,059
    $2,100
    $2,142
    $2,185
    $2,229
    $2,273
    $2,319
    $2,365
    $2,413
    $2,461
    $2,510
    $2,560
    $2,612
    $2,664
    $2,717
    Gross Operating Income
    $29,070
    $29,651
    $30,244
    $30,849
    $31,466
    $32,096
    $32,738
    $33,392
    $34,060
    $34,741
    $35,436
    $36,145
    $36,868
    $37,605
    $38,357
    $39,124
    $39,907
    $40,705
    $41,519
    $42,350
    $43,196
    $44,060
    $44,942
    $45,840
    $46,757
    $47,692
    $48,646
    $49,619
    $50,612
    $51,624
    Annual Operating Expenses
    Year 1Year 2Year 3Year 4Year 5Year 6Year 7Year 8Year 9Year 10Year 11Year 12Year 13Year 14Year 15Year 16Year 17Year 18Year 19Year 20Year 21Year 22Year 23Year 24Year 25Year 26Year 27Year 28Year 29Year 30
    Property Taxes
    $1,800
    $1,800
    $1,800
    $1,800
    $1,800
    $1,800
    $1,800
    $1,800
    $1,800
    $1,800
    $1,800
    $1,800
    $1,800
    $1,800
    $1,800
    $1,800
    $1,800
    $1,800
    $1,800
    $1,800
    $1,800
    $1,800
    $1,800
    $1,800
    $1,800
    $1,800
    $1,800
    $1,800
    $1,800
    $1,800
    Insurance
    $600
    $600
    $600
    $600
    $600
    $600
    $600
    $600
    $600
    $600
    $600
    $600
    $600
    $600
    $600
    $600
    $600
    $600
    $600
    $600
    $600
    $600
    $600
    $600
    $600
    $600
    $600
    $600
    $600
    $600
    Maintenance Assumption
    $1,224
    $1,248
    $1,273
    $1,299
    $1,325
    $1,351
    $1,378
    $1,406
    $1,434
    $1,463
    $1,492
    $1,522
    $1,552
    $1,583
    $1,615
    $1,647
    $1,680
    $1,714
    $1,748
    $1,783
    $1,819
    $1,855
    $1,892
    $1,930
    $1,969
    $2,008
    $2,048
    $2,089
    $2,131
    $2,174
    Property Management
    $3,060
    $3,121
    $3,184
    $3,247
    $3,312
    $3,378
    $3,446
    $3,515
    $3,585
    $3,657
    $3,730
    $3,805
    $3,881
    $3,958
    $4,038
    $4,118
    $4,201
    $4,285
    $4,370
    $4,458
    $4,547
    $4,638
    $4,731
    $4,825
    $4,922
    $5,020
    $5,121
    $5,223
    $5,328
    $5,434
    Owner-Paid Utilities / Landscaping
    $0
    $0
    $0
    $0
    $0
    $0
    $0
    $0
    $0
    $0
    $0
    $0
    $0
    $0
    $0
    $0
    $0
    $0
    $0
    $0
    $0
    $0
    $0
    $0
    $0
    $0
    $0
    $0
    $0
    $0
    Other Expense
    $0
    $0
    $0
    $0
    $0
    $0
    $0
    $0
    $0
    $0
    $0
    $0
    $0
    $0
    $0
    $0
    $0
    $0
    $0
    $0
    $0
    $0
    $0
    $0
    $0
    $0
    $0
    $0
    $0
    $0
    Total Operating Expenses
    $6,684
    $6,770
    $6,857
    $6,946
    $7,037
    $7,130
    $7,224
    $7,321
    $7,419
    $7,520
    $7,622
    $7,727
    $7,833
    $7,942
    $8,053
    $8,166
    $8,281
    $8,399
    $8,519
    $8,641
    $8,766
    $8,893
    $9,023
    $9,155
    $9,291
    $9,428
    $9,569
    $9,712
    $9,859
    $10,008
    Annual Debt Service
    Year 1Year 2Year 3Year 4Year 5Year 6Year 7Year 8Year 9Year 10Year 11Year 12Year 13Year 14Year 15Year 16Year 17Year 18Year 19Year 20Year 21Year 22Year 23Year 24Year 25Year 26Year 27Year 28Year 29Year 30
    Debt Service
    $18,501
    $18,501
    $18,501
    $18,501
    $18,501
    $18,501
    $18,501
    $18,501
    $18,501
    $18,501
    $18,501
    $18,501
    $18,501
    $18,501
    $18,501
    $18,501
    $18,501
    $18,501
    $18,501
    $18,501
    $18,501
    $18,501
    $18,501
    $18,501
    $18,501
    $18,501
    $18,501
    $18,501
    $18,501
    $18,501
    Mortgage Balance at Year End
    $282,963
    $278,509
    $273,827
    $268,905
    $263,732
    $258,294
    $252,578
    $246,570
    $240,254
    $233,614
    $226,636
    $219,300
    $211,589
    $203,483
    $194,963
    $186,006
    $176,592
    $166,696
    $156,293
    $145,358
    $133,864
    $121,782
    $109,082
    $95,732
    $81,699
    $66,947
    $51,442
    $35,143
    $18,010
    -
    Debt Service Coverage Ratio
    1.21%
    1.24%
    1.26%
    1.29%
    1.32%
    1.35%
    1.38%
    1.41%
    1.44%
    1.47%
    1.5%
    1.54%
    1.57%
    1.6%
    1.64%
    1.67%
    1.71%
    1.75%
    1.78%
    1.82%
    1.86%
    1.9%
    1.94%
    1.98%
    2.03%
    2.07%
    2.11%
    2.16%
    2.2%
    2.25%
    Annual Capital Improvements
    Year 1Year 2Year 3Year 4Year 5Year 6Year 7Year 8Year 9Year 10Year 11Year 12Year 13Year 14Year 15Year 16Year 17Year 18Year 19Year 20Year 21Year 22Year 23Year 24Year 25Year 26Year 27Year 28Year 29Year 30
    Capital Improvements
    $0
    $0
    $0
    $0
    $0
    $0
    $0
    $0
    $0
    $0
    $0
    $0
    $0
    $0
    $0
    $0
    $0
    $0
    $0
    $0
    $0
    $0
    $0
    $0
    $0
    $0
    $0
    $0
    $0
    $0
    Annual Cash Flow Analysis
    Year 1Year 2Year 3Year 4Year 5Year 6Year 7Year 8Year 9Year 10Year 11Year 12Year 13Year 14Year 15Year 16Year 17Year 18Year 19Year 20Year 21Year 22Year 23Year 24Year 25Year 26Year 27Year 28Year 29Year 30
    Net Operating Income
    $22,386
    $22,882
    $23,387
    $23,903
    $24,429
    $24,966
    $25,513
    $26,071
    $26,641
    $27,222
    $27,814
    $28,418
    $29,035
    $29,663
    $30,305
    $30,959
    $31,626
    $32,306
    $33,001
    $33,709
    $34,431
    $35,167
    $35,919
    $36,685
    $37,467
    $38,264
    $39,077
    $39,907
    $40,753
    $41,616
    Capitalization Rate
    6.2%
    6.4%
    6.5%
    6.7%
    6.8%
    7%
    7.1%
    7.3%
    7.4%
    7.6%
    7.7%
    7.9%
    8.1%
    8.3%
    8.4%
    8.6%
    8.8%
    9%
    9.2%
    9.4%
    9.6%
    9.8%
    10%
    10.2%
    10.4%
    10.7%
    10.9%
    11.1%
    11.4%
    11.6%
    Cash Flow Before Taxes
    $3,885
    $4,381
    $4,886
    $5,402
    $5,928
    $6,465
    $7,012
    $7,570
    $8,140
    $8,721
    $9,313
    $9,917
    $10,534
    $11,162
    $11,804
    $12,458
    $13,125
    $13,805
    $14,499
    $15,208
    $15,930
    $16,666
    $17,418
    $18,184
    $18,966
    $19,763
    $20,576
    $21,406
    $22,252
    $23,115
    Cash on Cash Return
    5%
    5.6%
    6.3%
    6.9%
    7.6%
    8.3%
    9%
    9.7%
    10.5%
    11.2%
    12%
    12.7%
    13.5%
    14.3%
    15.2%
    16%
    16.9%
    17.7%
    18.6%
    19.5%
    20.5%
    21.4%
    22.4%
    23.4%
    24.4%
    25.4%
    26.4%
    27.5%
    28.6%
    29.7%
    Annual Equity Accumulation
    Year 1Year 2Year 3Year 4Year 5Year 6Year 7Year 8Year 9Year 10Year 11Year 12Year 13Year 14Year 15Year 16Year 17Year 18Year 19Year 20Year 21Year 22Year 23Year 24Year 25Year 26Year 27Year 28Year 29Year 30
    Property Appreciation
    $14,360
    $14,934
    $15,532
    $16,153
    $16,799
    $17,471
    $18,170
    $18,897
    $19,653
    $20,439
    $21,256
    $22,107
    $22,991
    $23,910
    $24,867
    $25,862
    $26,896
    $27,972
    $29,091
    $30,254
    $31,465
    $32,723
    $34,032
    $35,393
    $36,809
    $38,281
    $39,813
    $41,405
    $43,061
    $44,784
    Mortgage Principal Pay Down
    $4,237
    $4,454
    $4,682
    $4,921
    $5,173
    $5,438
    $5,716
    $6,009
    $6,316
    $6,639
    $6,979
    $7,336
    $7,711
    $8,106
    $8,520
    $8,956
    $9,415
    $9,896
    $10,402
    $10,935
    $11,494
    $12,082
    $12,700
    $13,350
    $14,033
    $14,751
    $15,506
    $16,299
    $17,133
    $18,010
    Total Equity Growth
    $18,597
    $19,388
    $20,214
    $21,074
    $21,972
    $22,909
    $23,886
    $24,905
    $25,969
    $27,078
    $28,235
    $29,442
    $30,702
    $32,016
    $33,387
    $34,818
    $36,311
    $37,868
    $39,493
    $41,189
    $42,959
    $44,805
    $46,732
    $48,743
    $50,842
    $53,033
    $55,318
    $57,704
    $60,194
    $62,793
    Annual Tax Savings From Depreciation
    Year 1Year 2Year 3Year 4Year 5Year 6Year 7Year 8Year 9Year 10Year 11Year 12Year 13Year 14Year 15Year 16Year 17Year 18Year 19Year 20Year 21Year 22Year 23Year 24Year 25Year 26Year 27Year 28Year 29Year 30
    Straight Line Depreciation of Cost Basis
    $11,958
    $11,958
    $11,958
    $11,958
    $11,958
    $11,958
    $11,958
    $11,958
    $11,958
    $11,958
    $11,958
    $11,958
    $11,958
    $11,958
    $11,958
    $11,958
    $11,958
    $11,958
    $11,958
    $11,958
    $11,958
    $11,958
    $11,958
    $11,958
    $11,958
    $11,958
    $11,958
    $5,979
    $0
    $0
    Straight Line Depreciaiton of Lender Fees / Points
    $100
    $100
    $100
    $100
    $100
    $100
    $100
    $100
    $100
    $100
    $100
    $100
    $100
    $100
    $100
    $100
    $100
    $100
    $100
    $100
    $100
    $100
    $100
    $100
    $100
    $100
    $100
    $100
    $100
    $100
    Total Straight Line Depreciation
    $12,058
    $12,058
    $12,058
    $12,058
    $12,058
    $12,058
    $12,058
    $12,058
    $12,058
    $12,058
    $12,058
    $12,058
    $12,058
    $12,058
    $12,058
    $12,058
    $12,058
    $12,058
    $12,058
    $12,058
    $12,058
    $12,058
    $12,058
    $12,058
    $12,058
    $12,058
    $12,058
    $6,079
    $100
    $100
    Taxable Income Before Depreciation
    $8,122
    $8,835
    $9,568
    $10,324
    $11,101
    $11,903
    $12,728
    $13,579
    $14,456
    $15,360
    $16,292
    $17,253
    $18,245
    $19,268
    $20,324
    $21,414
    $22,539
    $23,702
    $24,902
    $26,142
    $27,424
    $28,748
    $30,118
    $31,534
    $32,999
    $34,514
    $36,082
    $37,705
    $39,385
    $41,125
    Carry Forward Loss From Depreciation
    $3,936
    $7,159
    $9,649
    $11,384
    $12,341
    $12,496
    $11,826
    $10,306
    $7,908
    $4,607
    $373
    $0
    $0
    $0
    $0
    $0
    $0
    $0
    $0
    $0
    $0
    $0
    $0
    $0
    $0
    $0
    $0
    $0
    $0
    $0
    Taxable Income Offset by Depreciation
    $8,122
    $8,835
    $9,568
    $10,324
    $11,101
    $11,903
    $12,728
    $13,579
    $14,456
    $15,360
    $16,292
    $12,431
    $12,058
    $12,058
    $12,058
    $12,058
    $12,058
    $12,058
    $12,058
    $12,058
    $12,058
    $12,058
    $12,058
    $12,058
    $12,058
    $12,058
    $12,058
    $6,079
    $100
    $100
    Remaining Taxable Income After Depreciation
    $0
    $0
    $0
    $0
    $0
    $0
    $0
    $0
    $0
    $0
    $0
    $4,822
    $6,187
    $7,210
    $8,266
    $9,356
    $10,481
    $11,643
    $12,844
    $14,084
    $15,366
    $16,690
    $18,060
    $19,476
    $20,941
    $22,456
    $24,024
    $31,626
    $39,285
    $41,025
    Federal Income Tax Owed on Rental Income
    $0
    $0
    $0
    $0
    $0
    $0
    $0
    $0
    $0
    $0
    $0
    $1,543
    $1,980
    $2,307
    $2,645
    $2,994
    $3,354
    $3,726
    $4,110
    $4,507
    $4,917
    $5,341
    $5,779
    $6,232
    $6,701
    $7,186
    $7,688
    $10,120
    $12,571
    $13,128
    Tax Savings from Depreciation
    $2,599
    $2,827
    $3,062
    $3,304
    $3,552
    $3,809
    $4,073
    $4,345
    $4,626
    $4,915
    $5,213
    $3,978
    $3,859
    $3,859
    $3,859
    $3,859
    $3,859
    $3,859
    $3,859
    $3,859
    $3,859
    $3,859
    $3,859
    $3,859
    $3,859
    $3,859
    $3,859
    $1,945
    $32
    $32
    Cash Flow After Taxes
    $3,885
    $4,381
    $4,886
    $5,402
    $5,928
    $6,465
    $7,012
    $7,570
    $8,140
    $8,721
    $9,313
    $8,374
    $8,554
    $8,855
    $9,159
    $9,464
    $9,771
    $10,079
    $10,389
    $10,701
    $11,013
    $11,325
    $11,638
    $11,952
    $12,265
    $12,577
    $12,889
    $11,286
    $9,681
    $9,987
    Performance Over Time
    Year 1Year 2Year 3Year 4Year 5Year 6Year 7Year 8Year 9Year 10Year 11Year 12Year 13Year 14Year 15Year 16Year 17Year 18Year 19Year 20Year 21Year 22Year 23Year 24Year 25Year 26Year 27Year 28Year 29Year 30
    Fair Market Property Value at Year End
    $373,360
    $388,294
    $403,826
    $419,979
    $436,778
    $454,250
    $472,420
    $491,316
    $510,969
    $531,408
    $552,664
    $574,771
    $597,761
    $621,672
    $646,539
    $672,400
    $699,296
    $727,268
    $756,359
    $786,613
    $818,078
    $850,801
    $884,833
    $920,226
    $957,035
    $995,317
    $1,035,129
    $1,076,534
    $1,119,596
    $1,164,380
    Cumulative Appreciation
    $14,360
    $29,294
    $44,826
    $60,979
    $77,778
    $95,250
    $113,420
    $132,316
    $151,969
    $172,408
    $193,664
    $215,771
    $238,761
    $262,672
    $287,539
    $313,400
    $340,296
    $368,268
    $397,359
    $427,613
    $459,078
    $491,801
    $525,833
    $561,226
    $598,035
    $636,317
    $676,129
    $717,534
    $760,596
    $805,380
    Cumulative Mortgage Principal Paydown
    $4,237
    $8,691
    $13,373
    $18,295
    $23,468
    $28,906
    $34,622
    $40,630
    $46,946
    $53,586
    $60,564
    $67,900
    $75,611
    $83,717
    $92,237
    $101,194
    $110,608
    $120,504
    $130,907
    $141,842
    $153,336
    $165,418
    $178,118
    $191,468
    $205,501
    $220,253
    $235,758
    $252,057
    $269,190
    $287,200
    Total Cumulative Equity
    $90,397
    $109,786
    $129,999
    $151,074
    $173,046
    $195,955
    $219,841
    $244,747
    $270,715
    $297,793
    $326,028
    $355,471
    $386,173
    $418,189
    $451,576
    $486,394
    $522,704
    $560,573
    $600,066
    $641,255
    $684,213
    $729,019
    $775,751
    $824,495
    $875,337
    $928,369
    $983,688
    $1,041,392
    $1,101,586
    $1,164,380
    Cumulative Cash Flow Before Taxes
    $3,885
    $8,266
    $13,152
    $18,554
    $24,482
    $30,947
    $37,959
    $45,529
    $53,669
    $62,390
    $71,703
    $81,620
    $92,153
    $103,316
    $115,119
    $127,577
    $140,702
    $154,507
    $169,007
    $184,214
    $200,144
    $216,810
    $234,228
    $252,412
    $271,377
    $291,141
    $311,717
    $333,123
    $355,375
    $378,490
    Cumulative Tax Savings From Depreciation
    $2,599
    $5,426
    $8,488
    $11,792
    $15,344
    $19,153
    $23,226
    $27,571
    $32,197
    $37,112
    $42,325
    $46,303
    $50,162
    $54,021
    $57,879
    $61,738
    $65,597
    $69,455
    $73,314
    $77,172
    $81,031
    $84,890
    $88,748
    $92,607
    $96,465
    $100,324
    $104,183
    $106,128
    $106,160
    $106,192
    Cumulative Cash Flow After Taxes
    $3,885
    $8,266
    $13,152
    $18,554
    $24,482
    $30,947
    $37,959
    $45,529
    $53,669
    $62,390
    $71,703
    $80,077
    $88,631
    $97,486
    $106,644
    $116,108
    $125,879
    $135,959
    $146,348
    $157,049
    $168,061
    $179,387
    $191,025
    $202,977
    $215,242
    $227,819
    $240,707
    $251,993
    $261,674
    $271,661
    Total Net Profit if Sold
    -
    $9,188
    $33,045
    $58,230
    $84,786
    $112,762
    $142,207
    $173,171
    $205,707
    $239,870
    $275,718
    $311,766
    $349,183
    $388,141
    $428,697
    $470,910
    $514,840
    $560,550
    $608,105
    $657,574
    $709,029
    $762,541
    $818,190
    $876,053
    $936,216
    $998,763
    $1,063,785
    $1,129,462
    $1,195,893
    $1,265,090
    Total Return on Investment if Sold
    -
    11.81%
    42.47%
    74.85%
    108.98%
    144.94%
    182.79%
    222.58%
    264.4%
    308.32%
    354.39%
    400.73%
    448.82%
    498.9%
    551.03%
    605.28%
    661.75%
    720.5%
    781.63%
    845.21%
    911.35%
    980.13%
    1051.66%
    1126.03%
    1203.36%
    1283.76%
    1367.33%
    1451.75%
    1537.14%
    1626.08%
    Before-Tax Return on Investment if Held
    28.9%
    30.6%
    32.3%
    34%
    35.9%
    37.8%
    39.7%
    41.7%
    43.8%
    46%
    48.3%
    50.6%
    53%
    55.5%
    58.1%
    60.8%
    63.5%
    66.4%
    69.4%
    72.5%
    75.7%
    79%
    82.5%
    86%
    89.7%
    93.6%
    97.6%
    101.7%
    106%
    110.4%
    After-Tax Return on Investment if Held
    28.9%
    30.6%
    32.3%
    34%
    35.9%
    37.8%
    39.7%
    41.7%
    43.8%
    46%
    48.3%
    48.6%
    50.5%
    52.5%
    54.7%
    56.9%
    59.2%
    61.6%
    64.1%
    66.7%
    69.4%
    72.1%
    75%
    78%
    81.1%
    84.3%
    87.7%
    88.7%
    89.8%
    93.5%
    Internal Rate of Return (IRR)
    -
    5.9%
    13.1%
    15.9%
    17.1%
    17.6%
    17.7%
    17.6%
    17.4%
    17.2%
    17%
    16.7%
    16.5%
    16.3%
    16%
    15.8%
    15.6%
    15.4%
    15.2%
    15%
    14.8%
    14.7%
    14.5%
    14.4%
    14.2%
    14.1%
    14%
    13.9%
    13.7%
    13.6%