Own Cash-Flowing Rental Properties in the Best U.S. Markets From Anywhere!

Search
Close this search box.

Welcome to Indianapolis!

ABOUT Indianapolis

While much of the country braces for a recession, Indiana just had a record-breaking year of economic development, attracting over $22 Billion in Investment Capital and creating over 24,000 new jobs! Most of it was directed towards the Indianapolis MSA, a market whose residential population has grown over 20% in the last 15 years while the cost of living and the unemployment remain well below the national average.

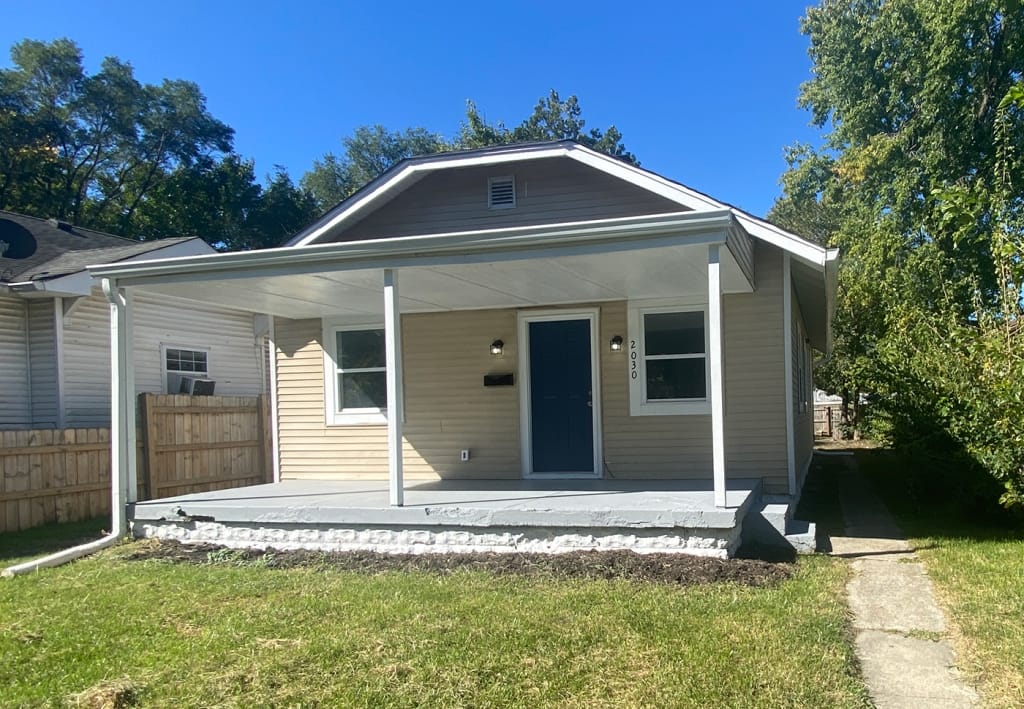
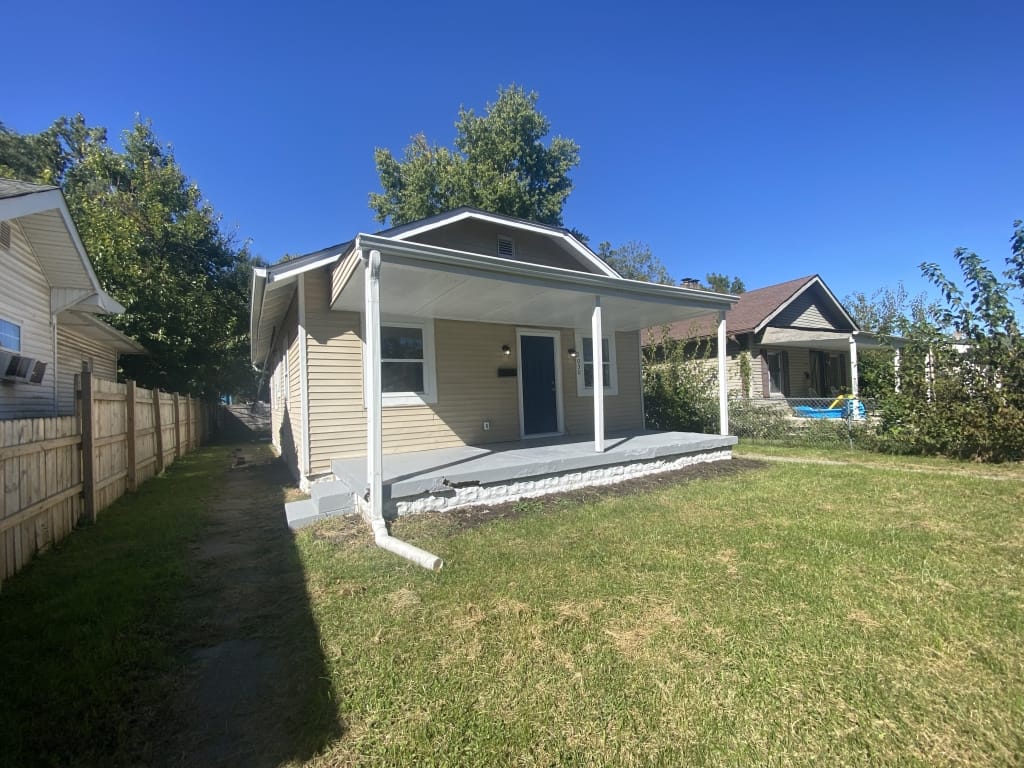
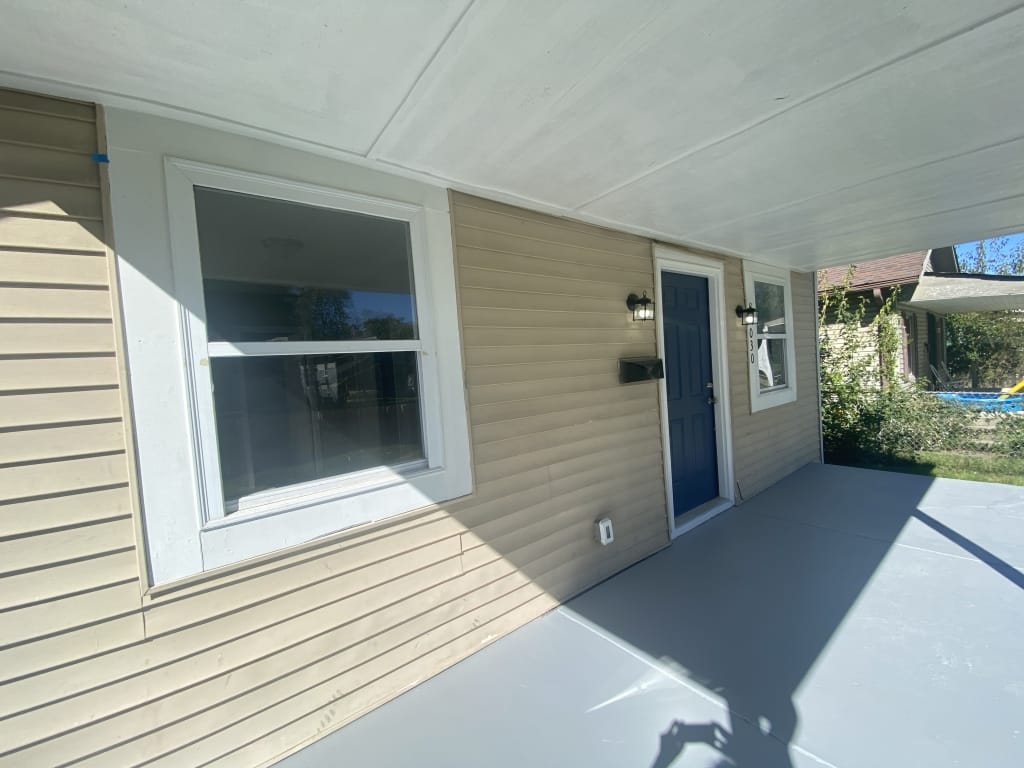
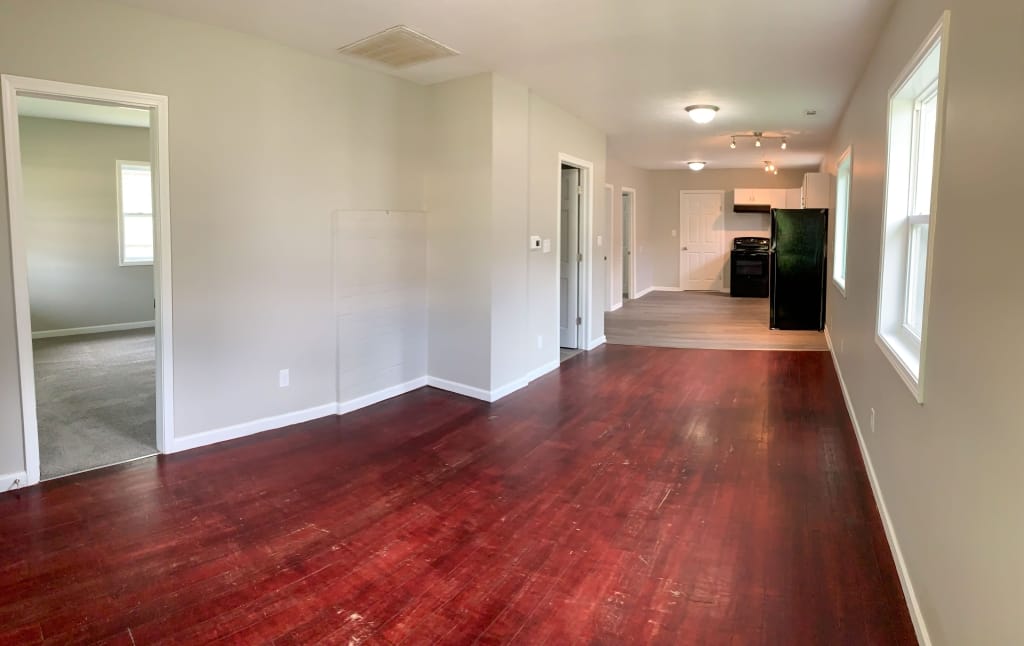
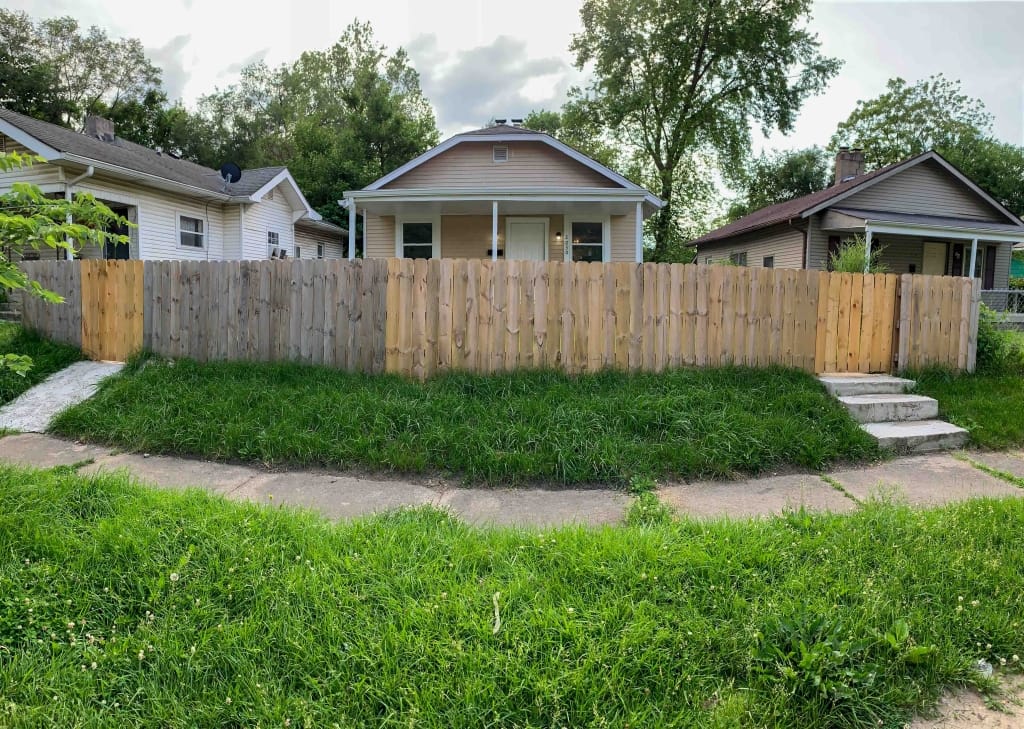
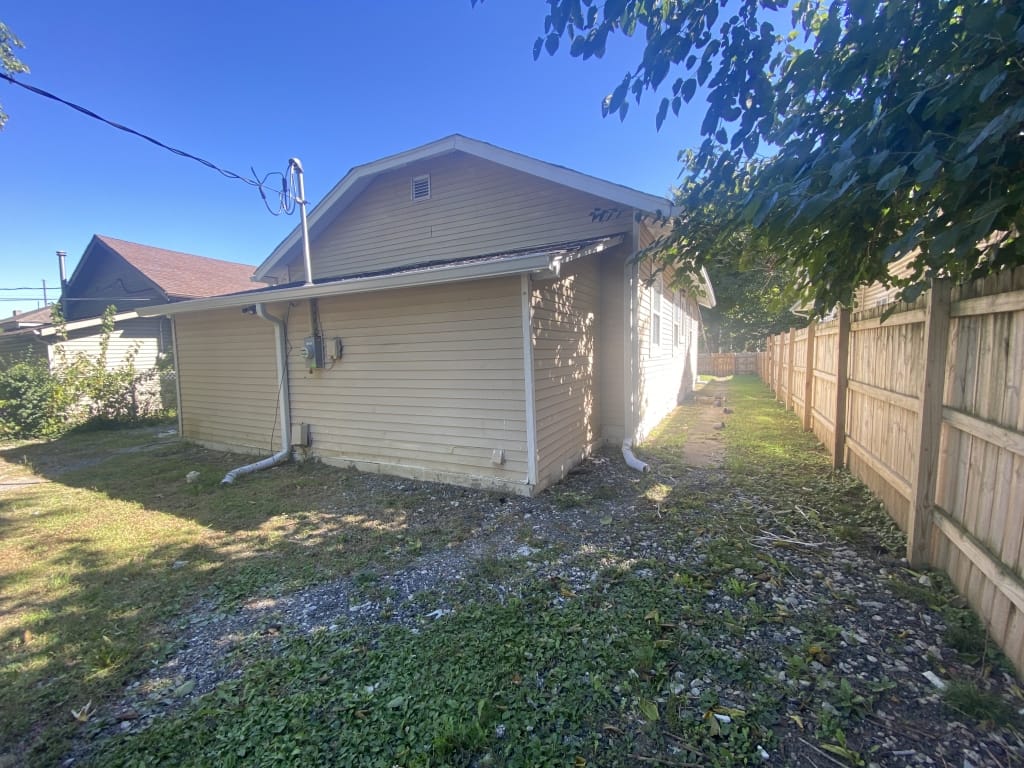
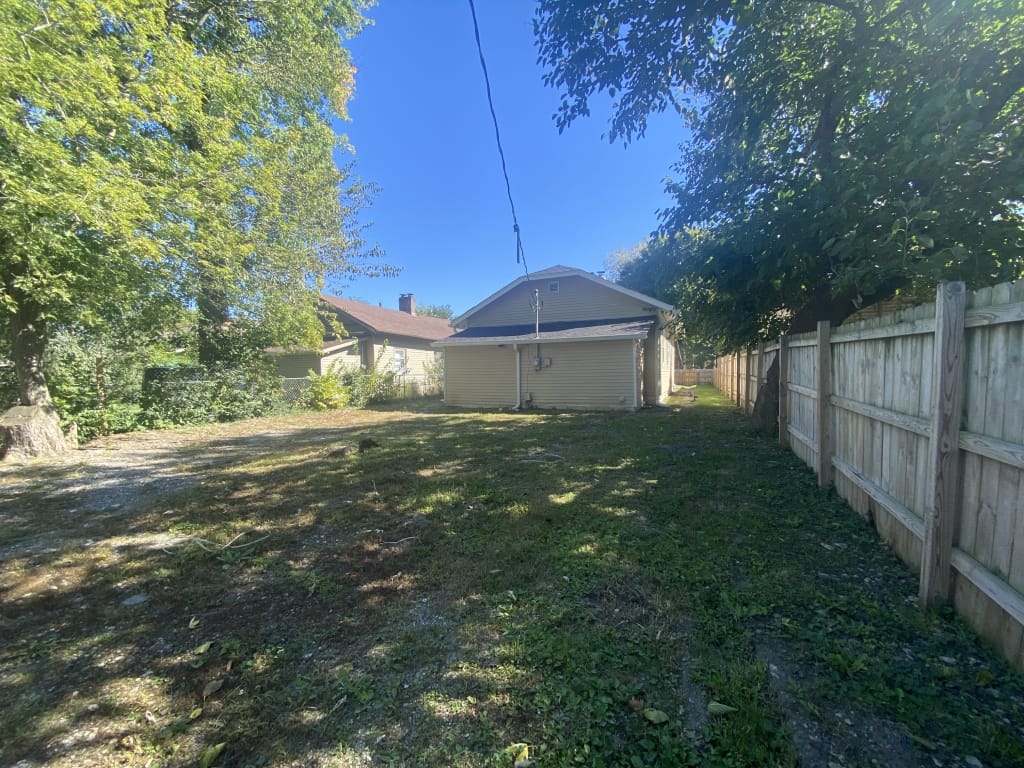
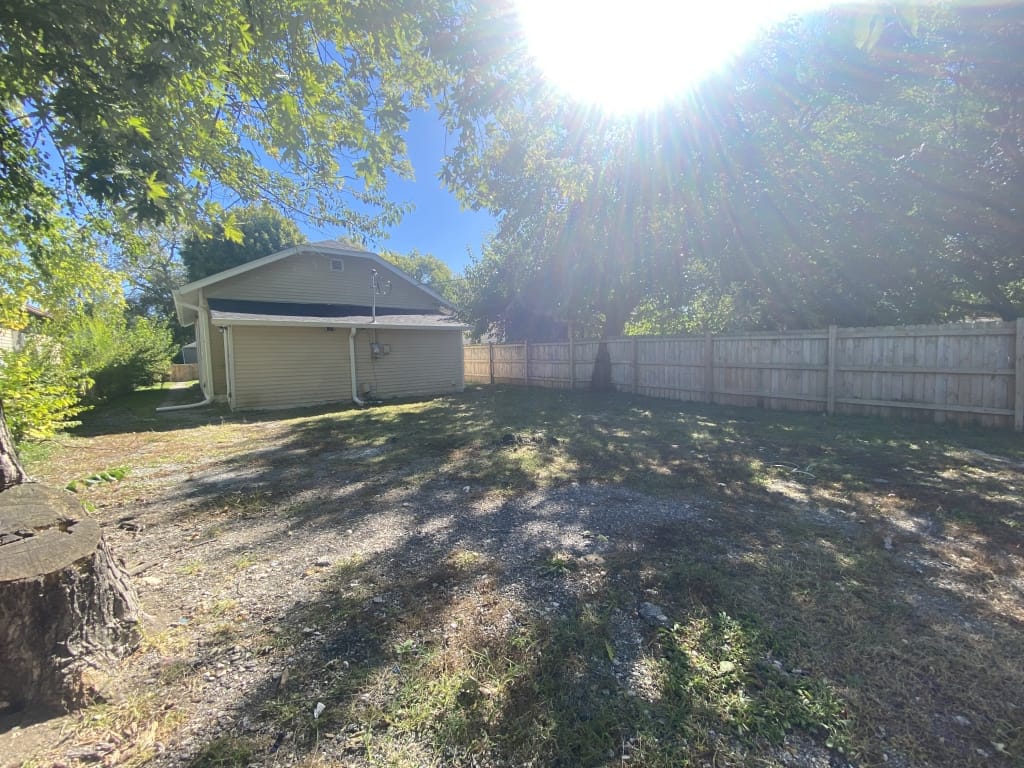
Houston Street Indianapolis, In

RESERVE THIS PROPERTY

OFFERED BY THE SELLER

  • 60 Day Rent Guarantee
  • 90 Day Scope-of-Work Warranty

Snapshot Financials

Price:
$ 160000
Rent:
$ 1345 / mo
Taxes:

Estimated Property Taxes

$ 66.6667
Insurance:

Estimated Insurance

$ 800
HOA Fee:

Home Owners Association Fee

$ 0
PM Fee:

Property Management Fee

$ 107.6
Other:
$ 0
Other:
$ 0
Vacancy:

Based on 7%

$ 94.15
Repairs:

Based on 5%

$ 67.25
Total:

Total Monthly Expenses

$ 402.333
NOI:

Monthly Net Operating Income ('NOI') = Monthly Gross Scheduled Rent - Monthly Operating Expenses - 5% Maintenance Estimate - 7% Vacancy Estimates. NOI does not take into account any financing that you may be using. The NOI is always an 'estimate' and can never be guaranteed because it includes the non-fixed variables of 'maintenance' and 'vacancy' which vary over time.

$ 943 / mo
Cap Rate:

Capitalization Rate ('Cap Rate') = Annual Net Operating Income / Purchase Price. Cap Rate does not take into account any financing you may be using nor any closing costs you may be paying.

7.07 %
GRM:

Gross Rent Multiplier ('GRM') = Purchase Price / Annual Gross Scheduled Rent. GRM is only a price to rent ratio and does not take into account any operating expenses, financing, closing cost payments or maintenance and vacancy assumptions. And remember, GRM is like a golf score, the lower the better.
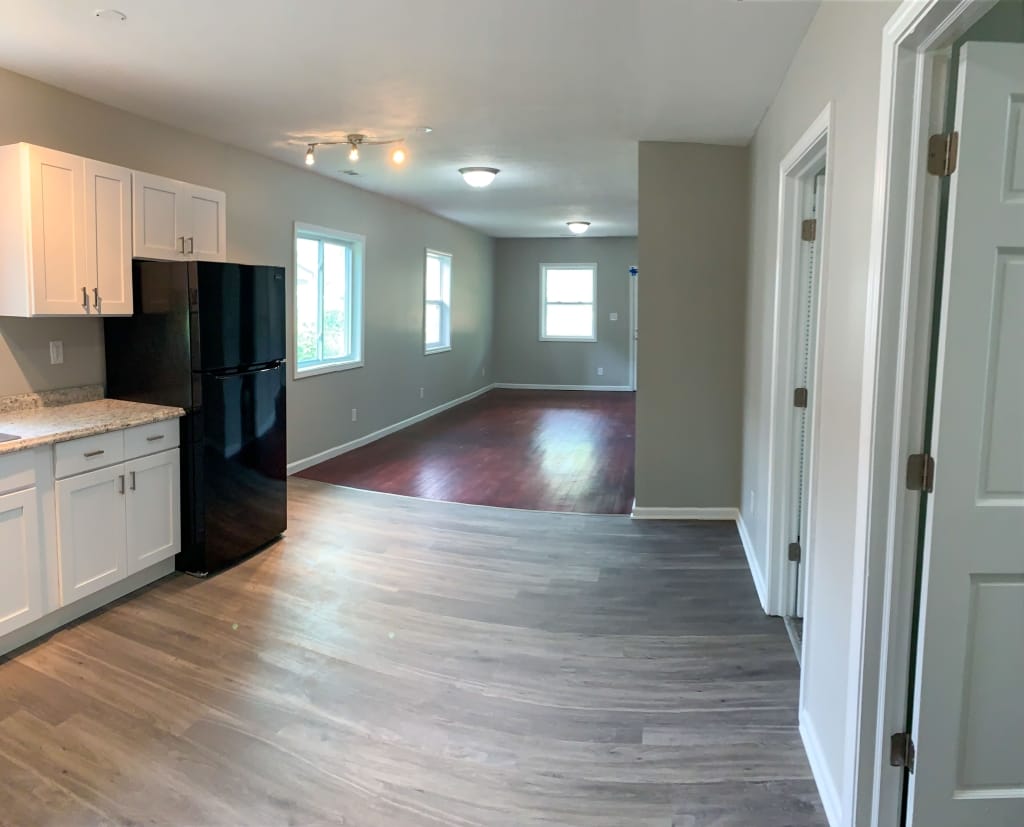
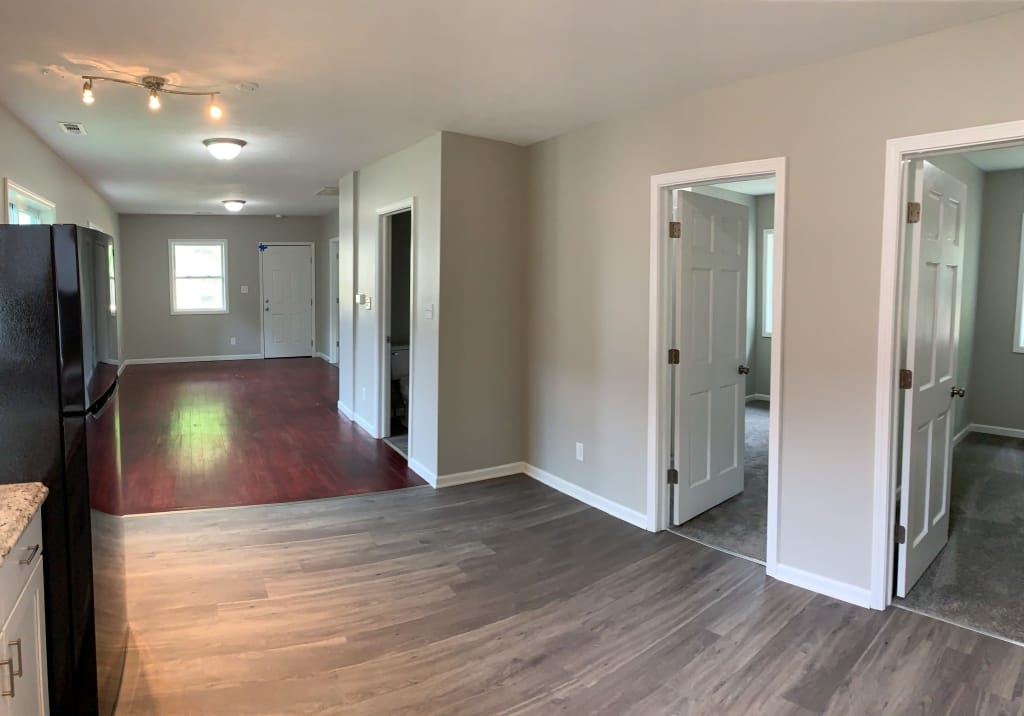
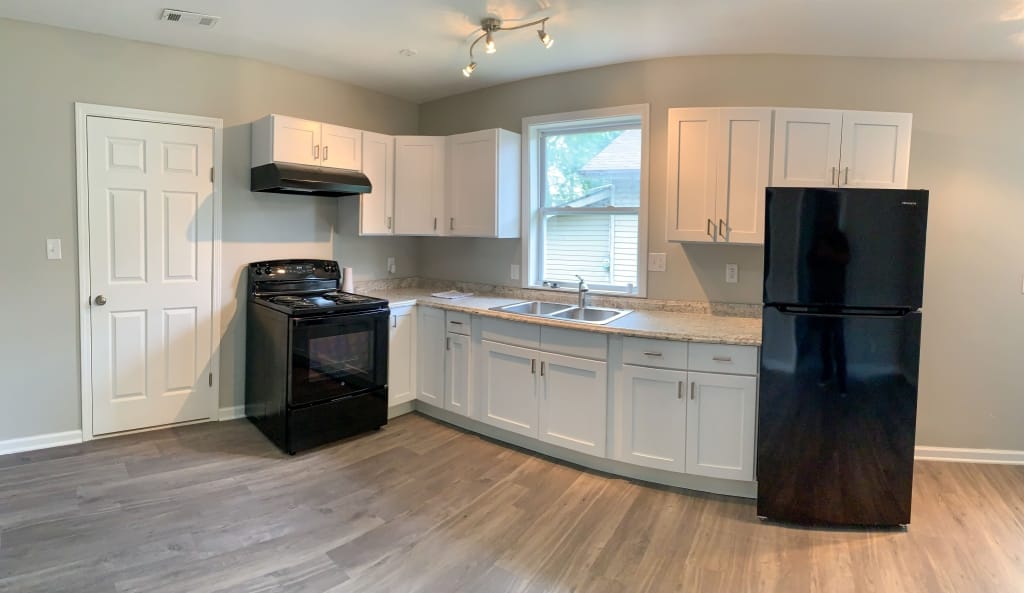
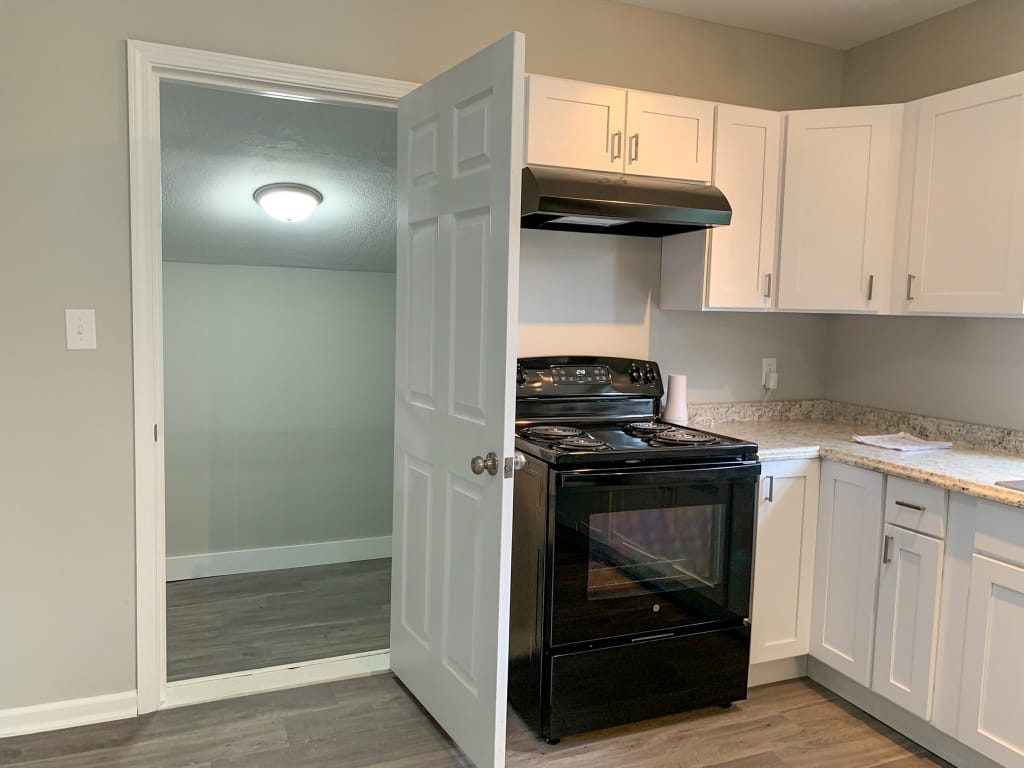
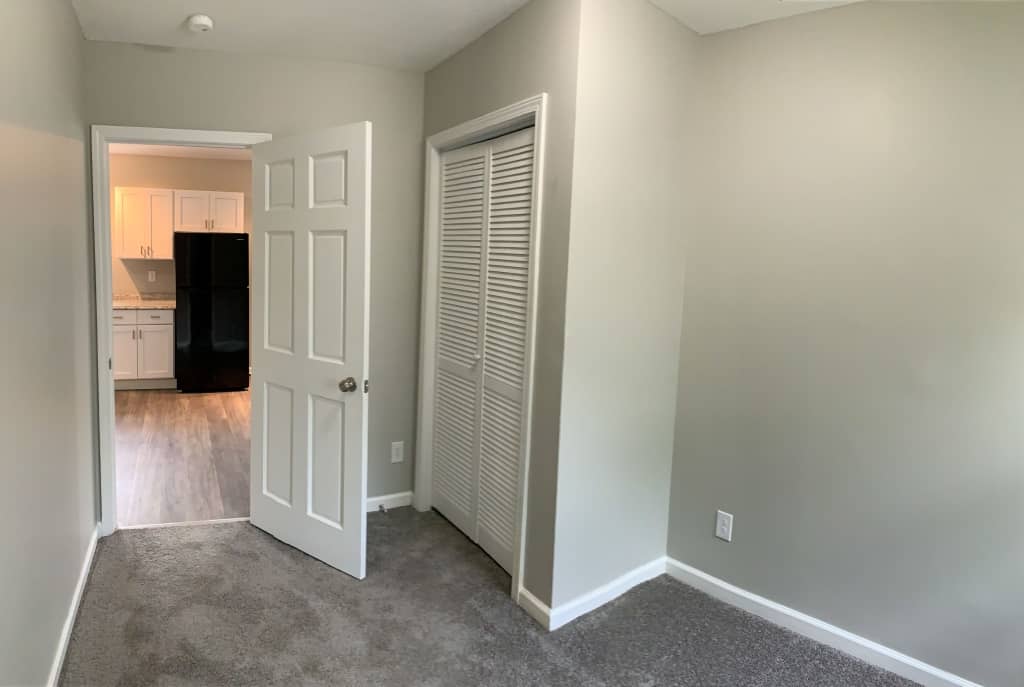
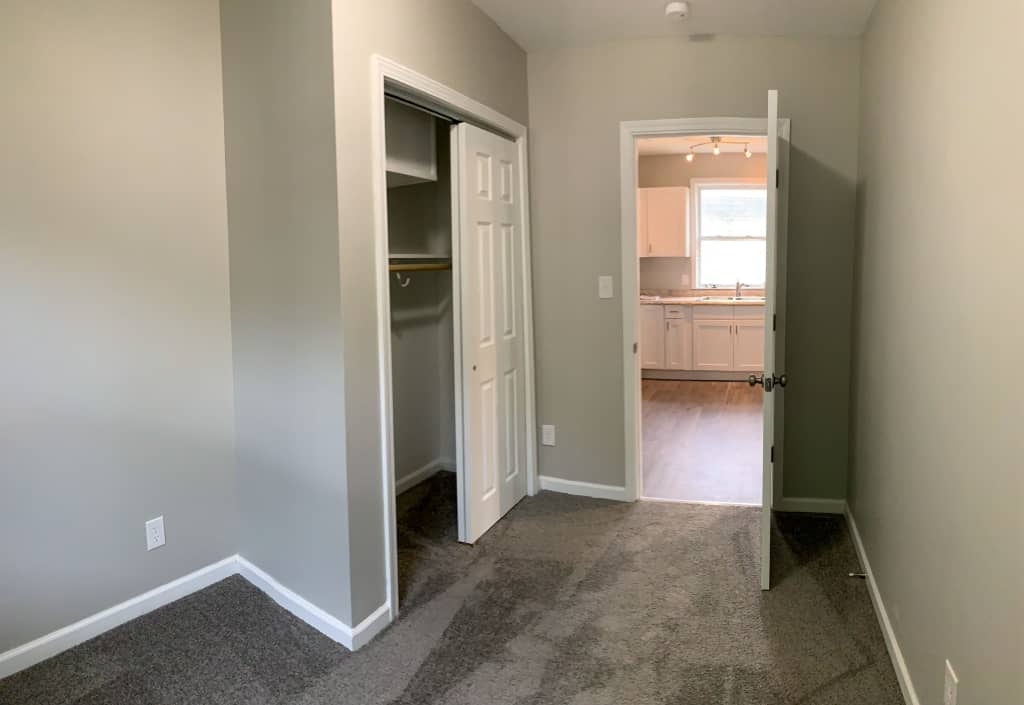
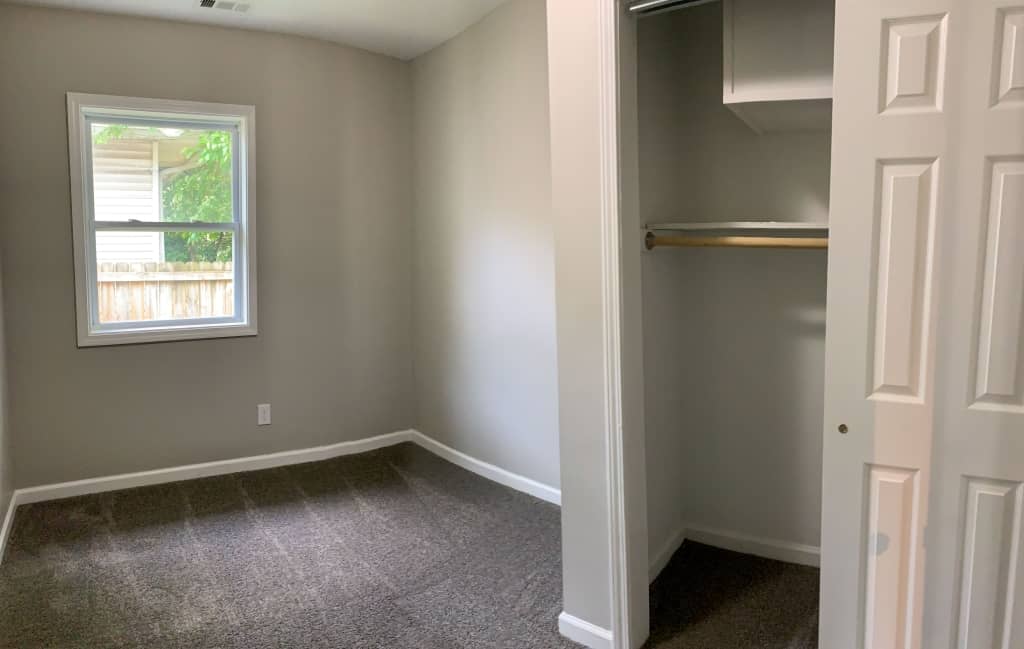
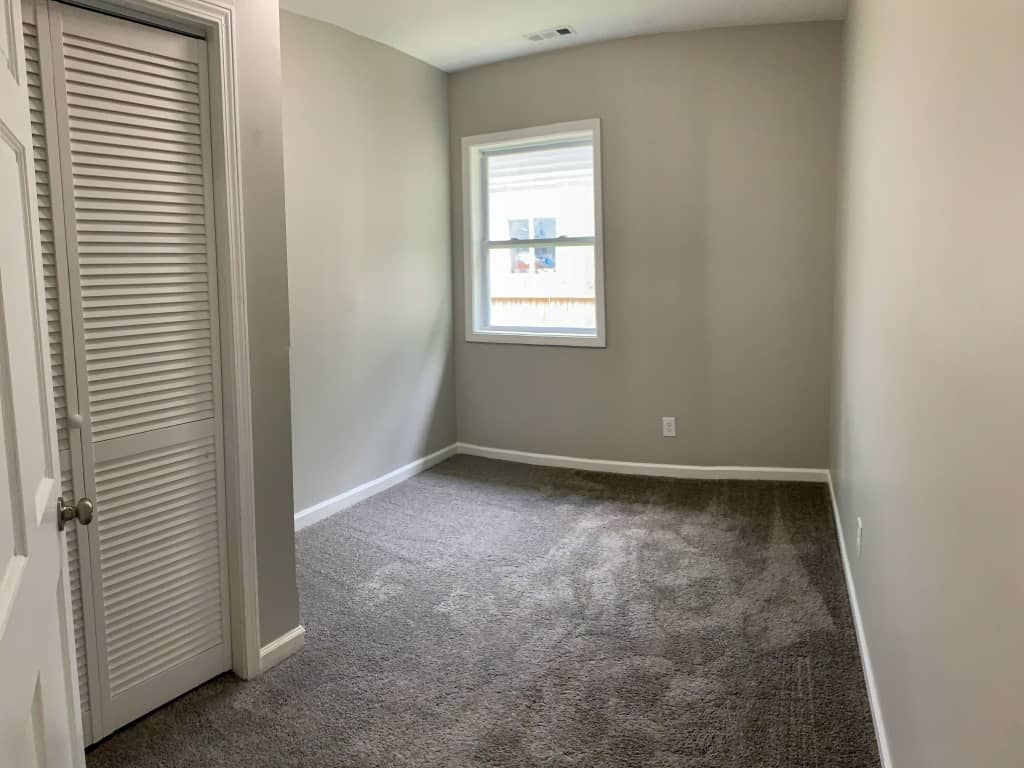
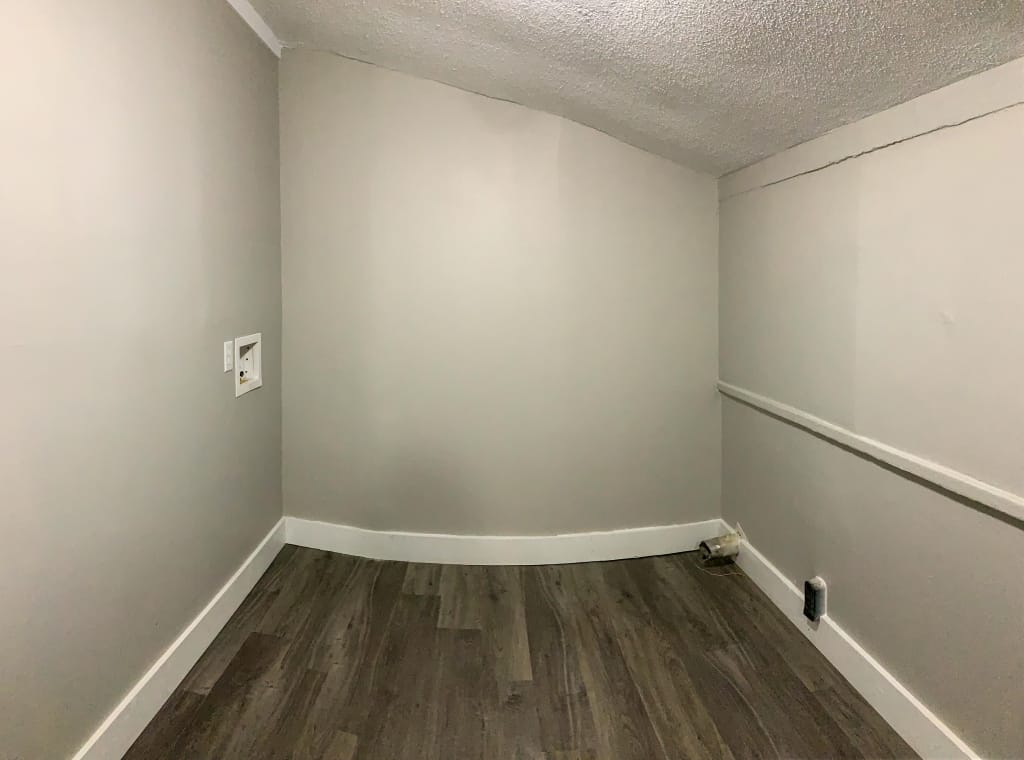
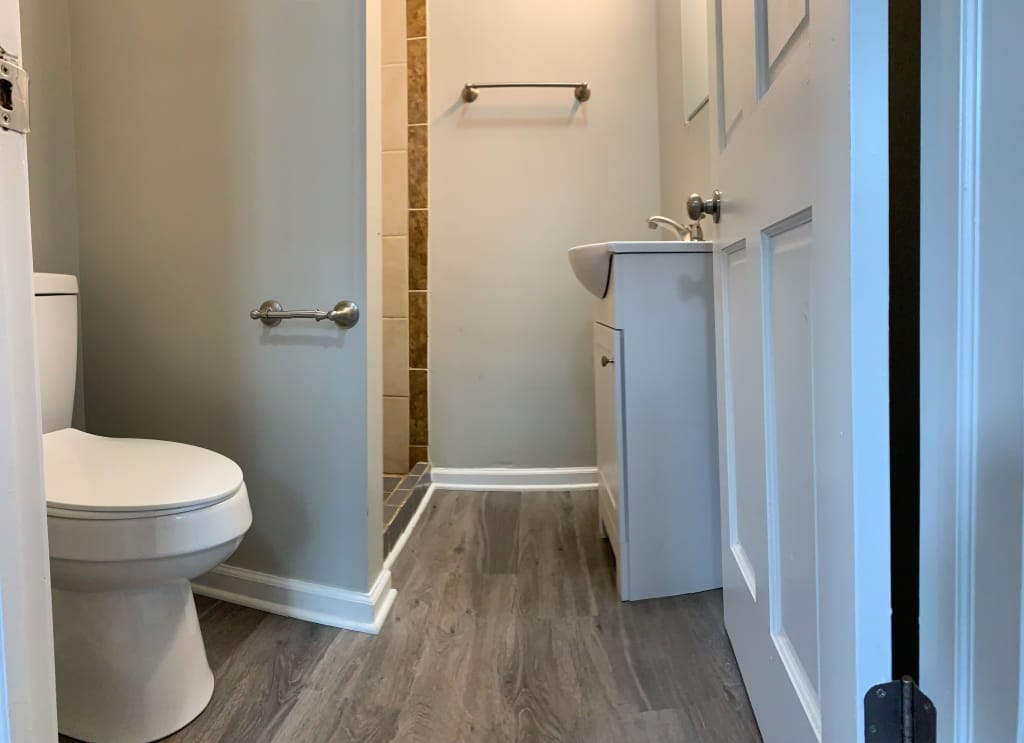
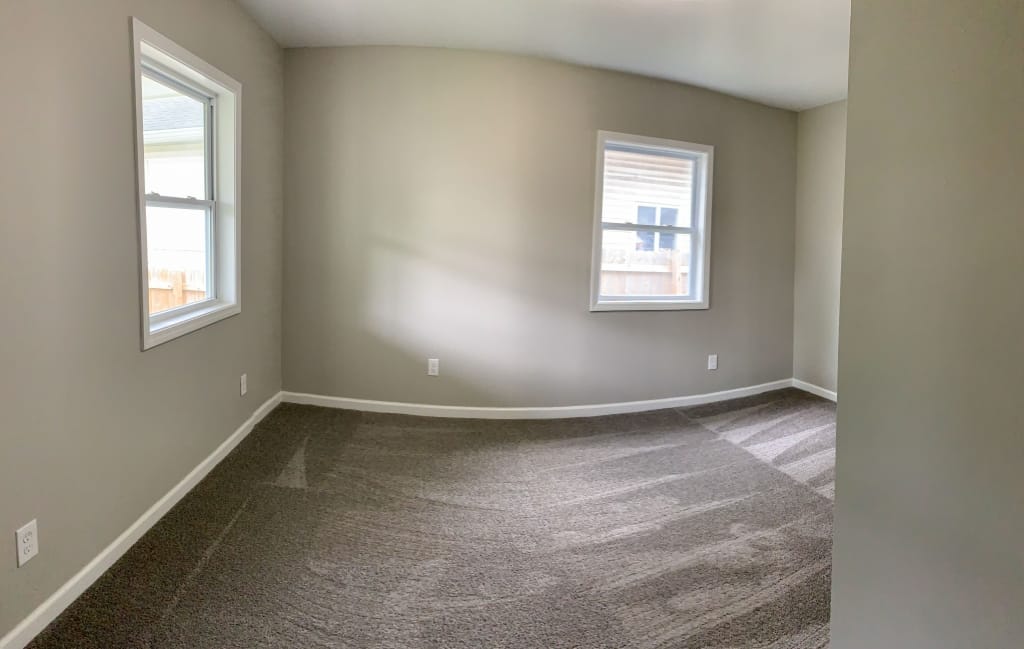
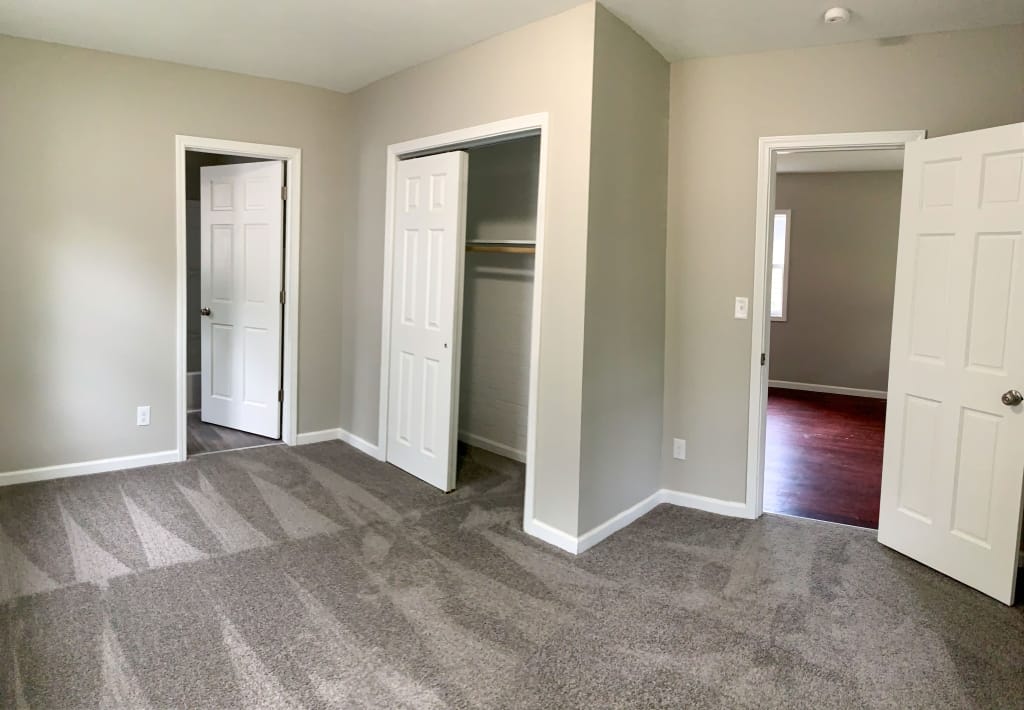
9.91

Property Features

Type:
Single Family Home
Condition:
Fully Renovated as Condition of Closing
Rental Status:
Tenant in Place as Condition of Closing
Year Built:
1931
Bedrooms:
3
Bathrooms:
2.0
Floor Area:
1100 Sq Ft
Lot Size:
n/a
Stories:
n/a
Basement:
No Basement
Parking:
Off-Street Parking
RESERVE THIS PROPERTY

Indianapolis Highlights

Indianapolis Properties:

  • Fully-Renovated Single Family Homes in Majority-Owner-Occupied Areas
  • Tenants and Local Property Management in Place
  • 7% Average Cap Rate
  • $150,000 Average Purchase Price
  • Hand-Selected Micro Markets

Indianapolis Market:

  • One of the most stable real estate markets in the country that declined less than 7% during recession (FHFA.gov).
  • Indianapolis has an unemployment rate below the national average (Source: BLS.gov).
  • Job growth – 22,900 jobs added in 2018.
  • College town – universities create consistent rental demand.

Similar
Properties

Maverick Property Vault

$675 Net Operating Income
$814 Net Operating Income
$949 Net Operating Income
$856 Net Operating Income

More Maverick Markets

Subscribe

    GET Access TO Private buying opportunities for TURNKEY Rental properies & EDUCATIONAL RESOURCES. READ OUR PRIVACY NOTICE & TERMS OF USE.

    Maverick's Cash-Flow Calculator

    DISCLAIMER
    OPEN

    This calculator is for recreational use only and is NOT financial or accounting software. There are a litany of variables that may be relevant to determining your individual tax obligations, financial performance and investment returns on a rental property that are NOT factored into this calculator. By using this calculator, you understand that the numbers herein are NOT specific projections of what your returns will actually be, and you agree that it is YOUR DUTY to consult with your own tax and financial professionals about the evaluation, risk assessment, realistic financial expectations, and actual tax obligations associated with any real estate investment. You also understand that ALL real estate investing involves risk, which buyer assumes 100%, and that no specific returns can ever be guaranteed by anyone.

    Top

    INSTRUCTIONS

    Click into any Investor INPUTS (THE ORANGE FIELDS) to modify.
    Click any field LABEL to view a definition.
    Click CALCULATE to update financial calculations on ALL TABS.
    Purchase
    Monthly Cashflow
    Tax Benefits
    Future Assumptions

    INSTRUCTIONS

    Click into any Investor INPUTS (THE ORANGE FIELDS) to modify.
    Click any field LABEL to view a definition.
    Click CALCULATE to update financial calculations on ALL TABS.
    Cash to Purchase
    Purchase Price
    $160,000
    Fair Market Value
    $160,000
    Down Payment Amount
    $32,000
    Depreciable Closing Costs
    $3,000
    Lender Fees / Points
    $3,000
    Total Cash Invested
    $38,000
    Total Equity at Purchase
    $32,000
    Morgage Calculation
    Loan Amount
    $128,000
    Monthly Mortgage Payment
    $687
    First Year Mortgage Principal Paid Down
    $1,888
    First Year Mortgage Interest Paid
    $6,357

    INSTRUCTIONS

    Click into any Investor INPUTS (THE ORANGE FIELDS) to modify.
    Click any field LABEL to view a definition.
    Click CALCULATE to update financial calculations on ALL TABS.
    First Year Monthly Cashflow
    Gross Scheduled Rent
    $1,345
    Vacancy Estimate
    $94
    Gross Operating Income
    $1,251
    Property Taxes
    $150
    Insurance
    $50
    Other Expense
    $0
    Owner-Paid Utilities / Landscaping
    $0
    Property Management Fee
    $135
    Maintenance Estimate
    $67
    Total Operating Expenses
    $402
    Net Operating Income (NOI)
    $849
    Mortgage Payment
    $687
    Cash Flow Before Taxes
    $162
    Gross Rent Multiplier (GRM)
    9.9
    Rent to Value Ratio (RV Ratio)
    0.8%
    Capitalization Rate (Cap Rate)
    6.4%
    Cash on Cash Return
    5.1%

    INSTRUCTIONS

    Click into any Investor INPUTS (THE ORANGE FIELDS) to modify.
    Click any field LABEL to view a definition.
    Click CALCULATE to update financial calculations on ALL TABS.
    Tax Benefits
    Value of (Non-Depreciable) Land
    $16,000
    Value of (Depreciable) Property Structure
    $144,000
    Depreciable "Cost Basis" at Purchase
    $147,000
    Annual Straight Line Depreciation of Cost Basis
    $5,345
    Annual Depreciation of Lender Fees / Costs
    $100
    First Year Total Depreciation
    $5,445
    First Year Taxable Income Before Depreciation
    $3,832
    First Year Taxable Income Offset by Depreciation
    $3,832
    First Year Remaining Taxable Income After Depreciation
    $0
    First Year Federal Income Taxes Owed on Rental Income
    $0
    First Year Tax Savings from Depreciation on Rental Income
    $1,226
    First Year Left Over Depreciation
    $1,613

    INSTRUCTIONS

    Click into any Investor INPUTS (THE ORANGE FIELDS) to modify.
    Click any field LABEL to view a definition.
    Click CALCULATE to update financial calculations on ALL TABS.
    (Swipe left or right to scroll horizontally)
    Annual Income
    Year 1Year 2Year 3Year 4Year 5Year 6Year 7Year 8Year 9Year 10Year 11Year 12Year 13Year 14Year 15Year 16Year 17Year 18Year 19Year 20Year 21Year 22Year 23Year 24Year 25Year 26Year 27Year 28Year 29Year 30
    Gross Scheduled Rent
    $16,140
    $16,463
    $16,792
    $17,128
    $17,470
    $17,820
    $18,176
    $18,540
    $18,911
    $19,289
    $19,675
    $20,068
    $20,469
    $20,879
    $21,296
    $21,722
    $22,157
    $22,600
    $23,052
    $23,513
    $23,983
    $24,463
    $24,952
    $25,451
    $25,960
    $26,479
    $27,009
    $27,549
    $28,100
    $28,662
    Vacancy Loss
    $1,130
    $1,152
    $1,175
    $1,199
    $1,223
    $1,247
    $1,272
    $1,298
    $1,324
    $1,350
    $1,377
    $1,405
    $1,433
    $1,462
    $1,491
    $1,521
    $1,551
    $1,582
    $1,614
    $1,646
    $1,679
    $1,712
    $1,747
    $1,782
    $1,817
    $1,854
    $1,891
    $1,928
    $1,967
    $2,006
    Gross Operating Income
    $15,010
    $15,310
    $15,617
    $15,929
    $16,248
    $16,572
    $16,904
    $17,242
    $17,587
    $17,939
    $18,297
    $18,663
    $19,037
    $19,417
    $19,806
    $20,202
    $20,606
    $21,018
    $21,438
    $21,867
    $22,304
    $22,750
    $23,205
    $23,670
    $24,143
    $24,626
    $25,118
    $25,621
    $26,133
    $26,656
    Annual Operating Expenses
    Year 1Year 2Year 3Year 4Year 5Year 6Year 7Year 8Year 9Year 10Year 11Year 12Year 13Year 14Year 15Year 16Year 17Year 18Year 19Year 20Year 21Year 22Year 23Year 24Year 25Year 26Year 27Year 28Year 29Year 30
    Property Taxes
    $1,800
    $1,800
    $1,800
    $1,800
    $1,800
    $1,800
    $1,800
    $1,800
    $1,800
    $1,800
    $1,800
    $1,800
    $1,800
    $1,800
    $1,800
    $1,800
    $1,800
    $1,800
    $1,800
    $1,800
    $1,800
    $1,800
    $1,800
    $1,800
    $1,800
    $1,800
    $1,800
    $1,800
    $1,800
    $1,800
    Insurance
    $600
    $600
    $600
    $600
    $600
    $600
    $600
    $600
    $600
    $600
    $600
    $600
    $600
    $600
    $600
    $600
    $600
    $600
    $600
    $600
    $600
    $600
    $600
    $600
    $600
    $600
    $600
    $600
    $600
    $600
    Maintenance Assumption
    $807
    $823
    $840
    $856
    $874
    $891
    $909
    $927
    $946
    $964
    $984
    $1,003
    $1,023
    $1,044
    $1,065
    $1,086
    $1,108
    $1,130
    $1,153
    $1,176
    $1,199
    $1,223
    $1,248
    $1,273
    $1,298
    $1,324
    $1,350
    $1,377
    $1,405
    $1,433
    Property Management
    $1,614
    $1,646
    $1,679
    $1,713
    $1,747
    $1,782
    $1,818
    $1,854
    $1,891
    $1,929
    $1,967
    $2,007
    $2,047
    $2,088
    $2,130
    $2,172
    $2,216
    $2,260
    $2,305
    $2,351
    $2,398
    $2,446
    $2,495
    $2,545
    $2,596
    $2,648
    $2,701
    $2,755
    $2,810
    $2,866
    Owner-Paid Utilities / Landscaping
    $0
    $0
    $0
    $0
    $0
    $0
    $0
    $0
    $0
    $0
    $0
    $0
    $0
    $0
    $0
    $0
    $0
    $0
    $0
    $0
    $0
    $0
    $0
    $0
    $0
    $0
    $0
    $0
    $0
    $0
    Other Expense
    $0
    $0
    $0
    $0
    $0
    $0
    $0
    $0
    $0
    $0
    $0
    $0
    $0
    $0
    $0
    $0
    $0
    $0
    $0
    $0
    $0
    $0
    $0
    $0
    $0
    $0
    $0
    $0
    $0
    $0
    Total Operating Expenses
    $4,821
    $4,869
    $4,919
    $4,969
    $5,021
    $5,073
    $5,126
    $5,181
    $5,237
    $5,293
    $5,351
    $5,410
    $5,470
    $5,532
    $5,594
    $5,658
    $5,724
    $5,790
    $5,858
    $5,927
    $5,997
    $6,069
    $6,143
    $6,218
    $6,294
    $6,372
    $6,451
    $6,532
    $6,615
    $6,699
    Annual Debt Service
    Year 1Year 2Year 3Year 4Year 5Year 6Year 7Year 8Year 9Year 10Year 11Year 12Year 13Year 14Year 15Year 16Year 17Year 18Year 19Year 20Year 21Year 22Year 23Year 24Year 25Year 26Year 27Year 28Year 29Year 30
    Debt Service
    $8,246
    $8,246
    $8,246
    $8,246
    $8,246
    $8,246
    $8,246
    $8,246
    $8,246
    $8,246
    $8,246
    $8,246
    $8,246
    $8,246
    $8,246
    $8,246
    $8,246
    $8,246
    $8,246
    $8,246
    $8,246
    $8,246
    $8,246
    $8,246
    $8,246
    $8,246
    $8,246
    $8,246
    $8,246
    $8,246
    Mortgage Balance at Year End
    $126,112
    $124,126
    $122,040
    $119,846
    $117,541
    $115,117
    $112,570
    $109,892
    $107,077
    $104,118
    $101,008
    $97,738
    $94,301
    $90,689
    $86,891
    $82,900
    $78,704
    $74,293
    $69,657
    $64,784
    $59,661
    $54,276
    $48,616
    $42,666
    $36,412
    $29,837
    $22,927
    $15,662
    $8,027
    -
    Debt Service Coverage Ratio
    1.24%
    1.27%
    1.3%
    1.33%
    1.36%
    1.39%
    1.43%
    1.46%
    1.5%
    1.53%
    1.57%
    1.61%
    1.65%
    1.68%
    1.72%
    1.76%
    1.8%
    1.85%
    1.89%
    1.93%
    1.98%
    2.02%
    2.07%
    2.12%
    2.16%
    2.21%
    2.26%
    2.31%
    2.37%
    2.42%
    Annual Capital Improvements
    Year 1Year 2Year 3Year 4Year 5Year 6Year 7Year 8Year 9Year 10Year 11Year 12Year 13Year 14Year 15Year 16Year 17Year 18Year 19Year 20Year 21Year 22Year 23Year 24Year 25Year 26Year 27Year 28Year 29Year 30
    Capital Improvements
    $0
    $0
    $0
    $0
    $0
    $0
    $0
    $0
    $0
    $0
    $0
    $0
    $0
    $0
    $0
    $0
    $0
    $0
    $0
    $0
    $0
    $0
    $0
    $0
    $0
    $0
    $0
    $0
    $0
    $0
    Annual Cash Flow Analysis
    Year 1Year 2Year 3Year 4Year 5Year 6Year 7Year 8Year 9Year 10Year 11Year 12Year 13Year 14Year 15Year 16Year 17Year 18Year 19Year 20Year 21Year 22Year 23Year 24Year 25Year 26Year 27Year 28Year 29Year 30
    Net Operating Income
    $10,189
    $10,441
    $10,698
    $10,960
    $11,227
    $11,499
    $11,777
    $12,061
    $12,350
    $12,645
    $12,946
    $13,253
    $13,566
    $13,885
    $14,211
    $14,543
    $14,882
    $15,228
    $15,580
    $15,940
    $16,307
    $16,681
    $17,063
    $17,452
    $17,849
    $18,254
    $18,667
    $19,088
    $19,518
    $19,956
    Capitalization Rate
    6.4%
    6.5%
    6.7%
    6.8%
    7%
    7.2%
    7.4%
    7.5%
    7.7%
    7.9%
    8.1%
    8.3%
    8.5%
    8.7%
    8.9%
    9.1%
    9.3%
    9.5%
    9.7%
    10%
    10.2%
    10.4%
    10.7%
    10.9%
    11.2%
    11.4%
    11.7%
    11.9%
    12.2%
    12.5%
    Cash Flow Before Taxes
    $1,944
    $2,195
    $2,452
    $2,714
    $2,981
    $3,254
    $3,532
    $3,815
    $4,105
    $4,400
    $4,701
    $5,008
    $5,321
    $5,640
    $5,966
    $6,298
    $6,637
    $6,982
    $7,335
    $7,695
    $8,061
    $8,435
    $8,817
    $9,206
    $9,603
    $10,008
    $10,421
    $10,843
    $11,273
    $11,711
    Cash on Cash Return
    5.1%
    5.8%
    6.5%
    7.1%
    7.8%
    8.6%
    9.3%
    10%
    10.8%
    11.6%
    12.4%
    13.2%
    14%
    14.8%
    15.7%
    16.6%
    17.5%
    18.4%
    19.3%
    20.2%
    21.2%
    22.2%
    23.2%
    24.2%
    25.3%
    26.3%
    27.4%
    28.5%
    29.7%
    30.8%
    Annual Equity Accumulation
    Year 1Year 2Year 3Year 4Year 5Year 6Year 7Year 8Year 9Year 10Year 11Year 12Year 13Year 14Year 15Year 16Year 17Year 18Year 19Year 20Year 21Year 22Year 23Year 24Year 25Year 26Year 27Year 28Year 29Year 30
    Property Appreciation
    $6,400
    $6,656
    $6,922
    $7,199
    $7,487
    $7,787
    $8,098
    $8,422
    $8,759
    $9,109
    $9,474
    $9,853
    $10,247
    $10,656
    $11,083
    $11,526
    $11,987
    $12,467
    $12,965
    $13,484
    $14,023
    $14,584
    $15,167
    $15,774
    $16,405
    $17,061
    $17,744
    $18,454
    $19,192
    $19,959
    Mortgage Principal Pay Down
    $1,888
    $1,985
    $2,087
    $2,193
    $2,306
    $2,424
    $2,548
    $2,678
    $2,815
    $2,959
    $3,110
    $3,269
    $3,437
    $3,613
    $3,797
    $3,992
    $4,196
    $4,411
    $4,636
    $4,873
    $5,123
    $5,385
    $5,660
    $5,950
    $6,254
    $6,574
    $6,911
    $7,264
    $7,636
    $8,027
    Total Equity Growth
    $8,288
    $8,641
    $9,009
    $9,393
    $9,793
    $10,210
    $10,646
    $11,100
    $11,574
    $12,068
    $12,584
    $13,122
    $13,683
    $14,269
    $14,880
    $15,518
    $16,183
    $16,877
    $17,601
    $18,357
    $19,146
    $19,969
    $20,828
    $21,724
    $22,659
    $23,636
    $24,654
    $25,718
    $26,828
    $27,986
    Annual Tax Savings From Depreciation
    Year 1Year 2Year 3Year 4Year 5Year 6Year 7Year 8Year 9Year 10Year 11Year 12Year 13Year 14Year 15Year 16Year 17Year 18Year 19Year 20Year 21Year 22Year 23Year 24Year 25Year 26Year 27Year 28Year 29Year 30
    Straight Line Depreciation of Cost Basis
    $5,445
    $5,445
    $5,445
    $5,445
    $5,445
    $5,445
    $5,445
    $5,445
    $5,445
    $5,445
    $5,445
    $5,445
    $5,445
    $5,445
    $5,445
    $5,445
    $5,445
    $5,445
    $5,445
    $5,445
    $5,445
    $5,445
    $5,445
    $5,445
    $5,445
    $5,445
    $5,445
    $2,723
    $0
    $0
    Straight Line Depreciaiton of Lender Fees / Points
    $100
    $100
    $100
    $100
    $100
    $100
    $100
    $100
    $100
    $100
    $100
    $100
    $100
    $100
    $100
    $100
    $100
    $100
    $100
    $100
    $100
    $100
    $100
    $100
    $100
    $100
    $100
    $100
    $100
    $100
    Total Straight Line Depreciation
    $5,545
    $5,545
    $5,545
    $5,545
    $5,545
    $5,545
    $5,545
    $5,545
    $5,545
    $5,545
    $5,545
    $5,545
    $5,545
    $5,545
    $5,545
    $5,545
    $5,545
    $5,545
    $5,545
    $5,545
    $5,545
    $5,545
    $5,545
    $5,545
    $5,545
    $5,545
    $5,545
    $2,823
    $100
    $100
    Taxable Income Before Depreciation
    $3,832
    $4,180
    $4,539
    $4,908
    $5,287
    $5,677
    $6,079
    $6,493
    $6,920
    $7,359
    $7,811
    $8,277
    $8,757
    $9,252
    $9,763
    $10,289
    $10,833
    $11,393
    $11,971
    $12,568
    $13,184
    $13,820
    $14,477
    $15,156
    $15,858
    $16,583
    $17,332
    $18,107
    $18,908
    $19,737
    Carry Forward Loss From Depreciation
    $1,713
    $3,078
    $4,085
    $4,723
    $4,981
    $4,849
    $4,315
    $3,367
    $1,993
    $180
    $0
    $0
    $0
    $0
    $0
    $0
    $0
    $0
    $0
    $0
    $0
    $0
    $0
    $0
    $0
    $0
    $0
    $0
    $0
    $0
    Taxable Income Offset by Depreciation
    $3,832
    $4,180
    $4,539
    $4,908
    $5,287
    $5,677
    $6,079
    $6,493
    $6,920
    $7,359
    $5,725
    $5,545
    $5,545
    $5,545
    $5,545
    $5,545
    $5,545
    $5,545
    $5,545
    $5,545
    $5,545
    $5,545
    $5,545
    $5,545
    $5,545
    $5,545
    $5,545
    $2,823
    $100
    $100
    Remaining Taxable Income After Depreciation
    $0
    $0
    $0
    $0
    $0
    $0
    $0
    $0
    $0
    $0
    $2,085
    $2,732
    $3,212
    $3,707
    $4,218
    $4,744
    $5,287
    $5,847
    $6,426
    $7,022
    $7,639
    $8,275
    $8,932
    $9,611
    $10,312
    $11,037
    $11,787
    $15,284
    $18,808
    $19,637
    Federal Income Tax Owed on Rental Income
    $0
    $0
    $0
    $0
    $0
    $0
    $0
    $0
    $0
    $0
    $667
    $874
    $1,028
    $1,186
    $1,350
    $1,518
    $1,692
    $1,871
    $2,056
    $2,247
    $2,444
    $2,648
    $2,858
    $3,075
    $3,300
    $3,532
    $3,772
    $4,891
    $6,019
    $6,284
    Tax Savings from Depreciation
    $1,226
    $1,338
    $1,452
    $1,570
    $1,692
    $1,817
    $1,945
    $2,078
    $2,214
    $2,355
    $1,832
    $1,775
    $1,775
    $1,775
    $1,775
    $1,775
    $1,775
    $1,775
    $1,775
    $1,775
    $1,775
    $1,775
    $1,775
    $1,775
    $1,775
    $1,775
    $1,775
    $903
    $32
    $32
    Cash Flow After Taxes
    $1,944
    $2,195
    $2,452
    $2,714
    $2,981
    $3,254
    $3,532
    $3,815
    $4,105
    $4,400
    $4,033
    $4,133
    $4,293
    $4,454
    $4,616
    $4,780
    $4,945
    $5,111
    $5,279
    $5,447
    $5,617
    $5,788
    $5,959
    $6,131
    $6,303
    $6,476
    $6,650
    $5,952
    $5,254
    $5,427
    Performance Over Time
    Year 1Year 2Year 3Year 4Year 5Year 6Year 7Year 8Year 9Year 10Year 11Year 12Year 13Year 14Year 15Year 16Year 17Year 18Year 19Year 20Year 21Year 22Year 23Year 24Year 25Year 26Year 27Year 28Year 29Year 30
    Fair Market Property Value at Year End
    $166,400
    $173,056
    $179,978
    $187,177
    $194,664
    $202,451
    $210,549
    $218,971
    $227,730
    $236,839
    $246,313
    $256,165
    $266,412
    $277,068
    $288,151
    $299,677
    $311,664
    $324,131
    $337,096
    $350,580
    $364,603
    $379,187
    $394,354
    $410,129
    $426,534
    $443,595
    $461,339
    $479,793
    $498,984
    $518,944
    Cumulative Appreciation
    $6,400
    $13,056
    $19,978
    $27,177
    $34,664
    $42,451
    $50,549
    $58,971
    $67,730
    $76,839
    $86,313
    $96,165
    $106,412
    $117,068
    $128,151
    $139,677
    $151,664
    $164,131
    $177,096
    $190,580
    $204,603
    $219,187
    $234,354
    $250,129
    $266,534
    $283,595
    $301,339
    $319,793
    $338,984
    $358,944
    Cumulative Mortgage Principal Paydown
    $1,888
    $3,874
    $5,960
    $8,154
    $10,459
    $12,883
    $15,430
    $18,108
    $20,923
    $23,882
    $26,992
    $30,262
    $33,699
    $37,311
    $41,109
    $45,100
    $49,296
    $53,707
    $58,343
    $63,216
    $68,339
    $73,724
    $79,384
    $85,334
    $91,588
    $98,163
    $105,073
    $112,338
    $119,973
    $128,000
    Total Cumulative Equity
    $40,288
    $48,930
    $57,938
    $67,331
    $77,124
    $87,334
    $97,979
    $109,079
    $120,653
    $132,721
    $145,305
    $158,427
    $172,110
    $186,379
    $201,260
    $216,777
    $232,960
    $249,837
    $267,439
    $285,796
    $304,942
    $324,911
    $345,739
    $367,463
    $390,122
    $413,758
    $438,412
    $464,130
    $490,958
    $518,944
    Cumulative Cash Flow Before Taxes
    $1,944
    $4,139
    $6,591
    $9,305
    $12,287
    $15,541
    $19,073
    $22,888
    $26,993
    $31,392
    $36,093
    $41,101
    $46,421
    $52,061
    $58,027
    $64,324
    $70,961
    $77,943
    $85,278
    $92,973
    $101,034
    $109,470
    $118,287
    $127,493
    $137,096
    $147,105
    $157,526
    $168,369
    $179,641
    $191,352
    Cumulative Tax Savings From Depreciation
    $1,226
    $2,564
    $4,016
    $5,587
    $7,279
    $9,096
    $11,041
    $13,119
    $15,333
    $17,688
    $19,520
    $21,295
    $23,069
    $24,844
    $26,618
    $28,393
    $30,167
    $31,942
    $33,716
    $35,491
    $37,265
    $39,040
    $40,815
    $42,589
    $44,364
    $46,138
    $47,913
    $48,816
    $48,848
    $48,880
    Cumulative Cash Flow After Taxes
    $1,944
    $4,139
    $6,591
    $9,305
    $12,287
    $15,541
    $19,073
    $22,888
    $26,993
    $31,392
    $35,426
    $39,559
    $43,852
    $48,306
    $52,922
    $57,701
    $62,646
    $67,757
    $73,036
    $78,483
    $84,100
    $89,888
    $95,847
    $101,977
    $108,281
    $114,757
    $121,407
    $127,359
    $132,613
    $138,040
    Total Net Profit if Sold
    -
    $1,224
    $12,131
    $23,662
    $35,837
    $48,678
    $62,208
    $76,450
    $91,427
    $107,167
    $123,026
    $139,493
    $156,649
    $174,520
    $193,129
    $212,504
    $232,673
    $253,664
    $275,507
    $298,233
    $321,874
    $346,464
    $372,037
    $398,630
    $426,280
    $455,028
    $484,912
    $515,106
    $545,652
    $577,468
    Total Return on Investment if Sold
    -
    3.22%
    31.92%
    62.27%
    94.31%
    128.1%
    163.71%
    201.18%
    240.6%
    282.02%
    323.75%
    367.09%
    412.24%
    459.26%
    508.23%
    559.22%
    612.3%
    667.54%
    725.02%
    784.82%
    847.04%
    911.75%
    979.04%
    1049.03%
    1121.79%
    1197.44%
    1276.08%
    1355.54%
    1435.93%
    1519.65%
    Before-Tax Return on Investment if Held
    26.9%
    28.5%
    30.2%
    31.9%
    33.6%
    35.4%
    37.3%
    39.3%
    41.3%
    43.3%
    45.5%
    47.7%
    50%
    52.4%
    54.9%
    57.4%
    60.1%
    62.8%
    65.6%
    68.6%
    71.6%
    74.7%
    78%
    81.4%
    84.9%
    88.5%
    92.3%
    96.2%
    100.3%
    104.5%
    After-Tax Return on Investment if Held
    26.9%
    28.5%
    30.2%
    31.9%
    33.6%
    35.4%
    37.3%
    39.3%
    41.3%
    43.3%
    43.7%
    45.4%
    47.3%
    49.3%
    51.3%
    53.4%
    55.6%
    57.9%
    60.2%
    62.6%
    65.2%
    67.8%
    70.5%
    73.3%
    76.2%
    79.2%
    82.4%
    83.3%
    84.4%
    87.9%
    Internal Rate of Return (IRR)
    -
    1.6%
    10.1%
    13.7%
    15.4%
    16.2%
    16.5%
    16.6%
    16.6%
    16.5%
    16.4%
    16.2%
    16%
    15.8%
    15.6%
    15.5%
    15.3%
    15.1%
    15%
    14.8%
    14.7%
    14.5%
    14.4%
    14.3%
    14.1%
    14%
    13.9%
    13.8%
    13.7%
    13.6%